


When looking to understand the geodemographics of a country, a segmentation can be an invaluable tool for describing the differences between neighbourhoods to drive decision making, guiding you towards the areas where your customers or lookalikes are. Indeed, CACI’s Acorn helps thousands of organisations better understand and target their audiences within the UK market. One of the key ways Acorn differentiates between top-level Categories is by affluence, which is a crucial factor for a segmentation in a business context.
In the UK, there is a wealth of data we can draw upon to build geodemographic segmentations like Acorn, including a robust and detailed census, land registry, and most importantly, a well-defined, small-scale Postcode system. But in foreign markets, such detailed data often doesn’t exist, and where it does, it can be of poor quality, hard to verify and at a regional level. So, how can we build a reliable segmentation in these markets?
Satellite imagery as a novel approach
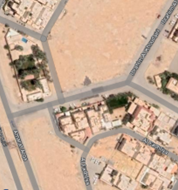
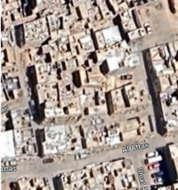
In the image on the left, there are large buildings, geometrically defined roads, pools and greenery, which is expensive to maintain in a desert country. This area is likely to be of a generally higher affluence. In the image on the right, there are buildings of uneven height, densely packed together along uneven and jagged roads. This area is likely to be of a generally lower affluence compared to the image on the left.
We can see by eye the differences between these areas, but we can’t feasibly label all the areas of a country manually. So, how to do we do this programmatically?
Enter Convolutional Neural Networks (CNNs), a well-established deep learning technique that’s the bedrock of image analysis. Inspired by the visual cortex of an animal, they are trained to identify the patterns and shapes in an image and use this to predict the likely classification of objects or the image as a whole.
For successful usage of a CNN, however, quality training data is vital. In classic examples of image recognition, such as the MNIST dataset of handwritten digits, most people would have no issue labelling the training images correctly to feed to the model. This is trickier for labelling the affluence of a small area, though, as you need deep local knowledge and the time to manually label thousands of images to achieve a model with usable accuracy. CACI has invested heavily in building a robust pipeline for this process, allowing us to achieve the scale required for accurate modelling.
The unifying geography
We now have a methodology for generating some information about affluence, but we still have another problem to tackle – what geography should a segmentation be built at?
The natural response might be to consider administrative boundaries. This is the level at which most governmental social and economic data is released, so it makes sense to consider this as an option. However, the irregularity of the shape and size of administrative regions in many countries means that it can be hard to compare areas like-for-like, hampering effective decision making.
H3 – a geospatial indexing system developed at Uber – splits the globe into a grid of tessellated hexagons at varying scales, from the largest scale at 110 hexagons to the smallest at ~570 trillion hexagons. It’s gained popularity thanks to its ease of use, speed and availability of algorithms and optimisations for working in its geography.
H3 is a great alternative to Postcodes in areas where they can’t feasibly be used. It can be applied consistently across a country and at a low level of granularity, meaning that any segmentation applied at this level can clearly show the differences between areas in an accurate way. It’s also easy to aggregate up to other geographies, allowing you to integrate the data into other systems where data is not so granular.
How CACI can help
Combining the power of H3 hexagon geography with the information gained from analysing satellite images, we can gain great insight into the relative wealth of areas in countries where existing data is simply not available.
The ability to apply image analysis, however, means nothing without deep expertise in segmentation and location strategy. By combining your knowledge of your customers with our expertise in data science, insight and location, CACI can support you in your journey.
Whether you’re an established international organisation or looking to move into a new market, contact us today to find out how we can help you take the next step in achieving your goals.