It’s all about demand
Understanding demand is a key challenge for the water industry as it is a stepping stone in helping solve several puzzles such as distribution, understanding leakage, and helping customers reduce their water use. With some areas of the UK having low meter penetration, and standard meters only being read annually or even less frequently; demographic data is a key aspect in modelling demand to meet these challenges.
Recently, CACI ran a roundtable discussion on all things demand to understand how companies are tackling demand forecasting currently, and what innovations are being explored for the future. We ran the roundtable in conjunction with Anglian Water to share the work they are currently doing in this area, and Badger Meter who were part of the winning team at the recent “Innovate East” Hackathon.
USING DATA TO UNDERSTAND DEMAND – ADAM GRAY, ANGLIAN WATER
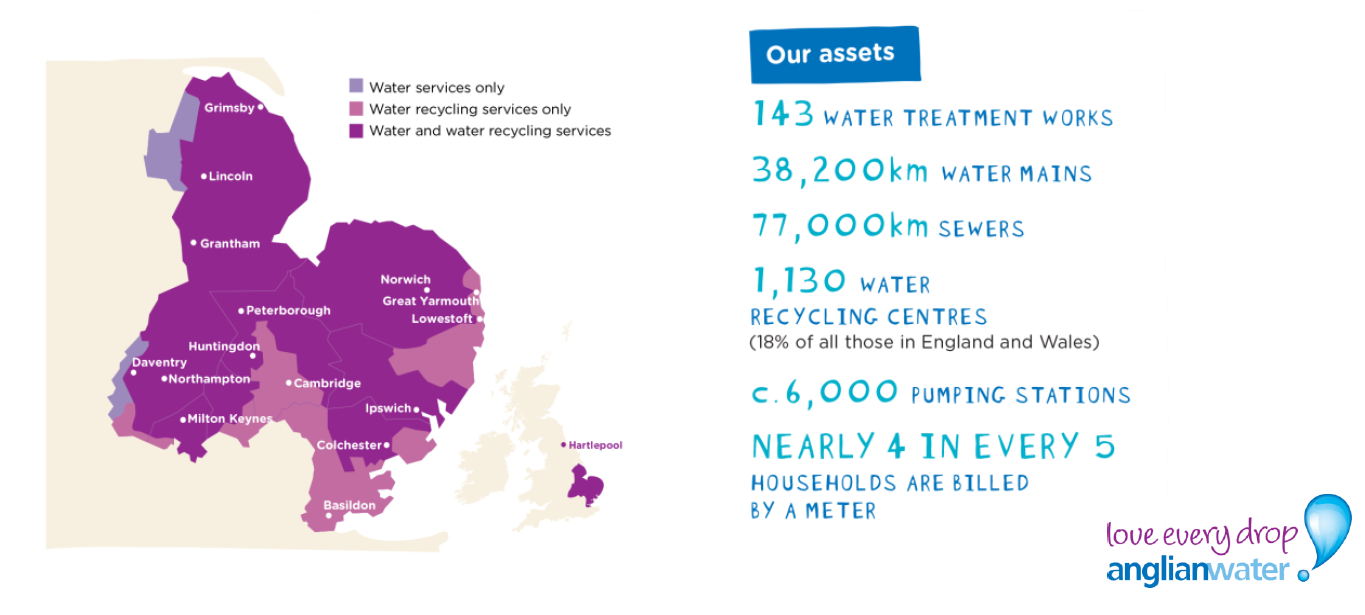
Anglian Water is one of the largest geographic water regions, spanning the East of England from Grimsby to Basildon. Unusually, Anglian has a 90% penetration of meters across their region.

One of the biggest challenges currently facing Anglian Water, as one of the driest areas in the UK, is climate change. The increased risk of drought and predicted reduction in rainfall for the region is a huge concern for the demand of water.
Another major challenge that Anglian is tackling is the continually increasing population growth in the area. Located to the north and east of London, Anglian Water’s region contains 3 of the 5 fastest growing towns in England – Peterborough, Cambridge, and Milton Keynes. This means that in some areas the population could grow by more than 28% by 2045, again causing a huge increase in water demand.
To help tackle these challenges, it’s important to accurately understand the level of demand and therefore be able to calculate and tackle leakage in the area. To do this, Anglian use three main work streams:
- First, the survey of domestic consumption (SodCon) for which Anglian has 2,000 domestic customers on flow meters, collecting data every 15 minutes. CACI’s geodemographic segmentation Acorn is used to ensure a representative sample of customers have the flow meters.
- Secondly, for customers that are metered annually, Acorn is applied in conjunction with CACI’s Household Occupancy data to calculate the average daily consumption.
- Thirdly, Anglian has approximately 17,000 customers on smart meters which collect hourly data. Acorn is applied to this data to again sort them into cohorts to build corresponding models.
The importance of smart meters in an area that is being increasingly challenged in terms of demand cannot be understated. Anglian has a programme in place to get 70% of their customers upgraded to smart meters by 2030, in order to further improve their understanding of how customers use water and plan for future local demand. Acorn will again be used in supporting the build of these models and to help quantify the day-to-day demand in areas that aren’t smart metered.
In addition, the smart meter data is a game-changer in terms of the understanding, modelling and reporting of leakage in a way that Anglian hasn’t been able to do before.
HELPING CUSTOMER SAVE WATER (AND MONEY) – ANNA CRISP, ANGLIAN WATER AND MICHAEL DAVIES, BADGER METER
At the beginning of September, Anglian Water along with Welsh Water and SES Water hosted the event ‘Innovate East’ – a two-week event focussed on innovation in the water industry. As part of the event, a data hack was held to explore what insights and actions could be driven from smart meter data.
The hack had the challenge statement of ‘Helping customers save water (and money)’ and teams were given Anglian’s smart meter data, along with occupancy data and CACI’s Household Acorn data to find innovative ways to approach and answer the challenge.

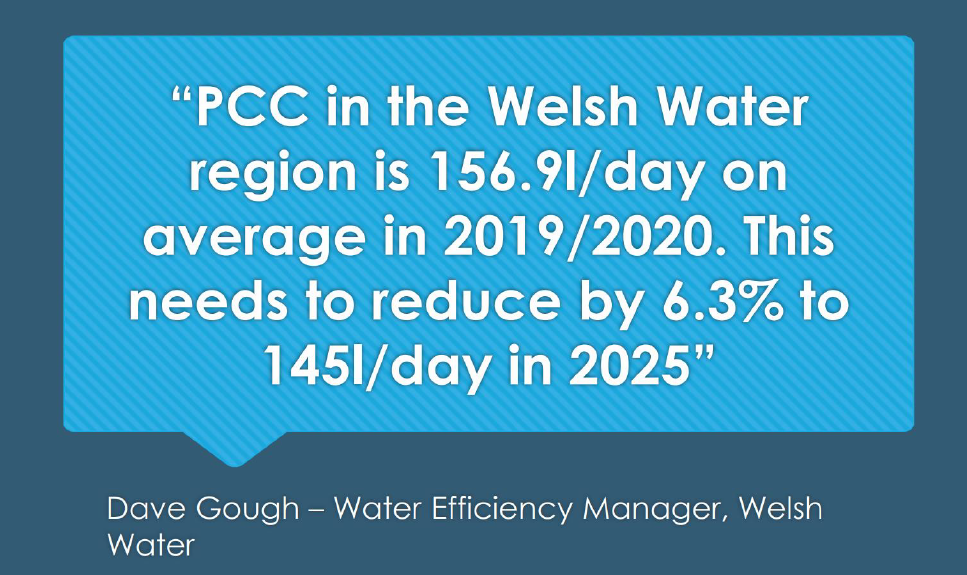
Using the above statement on the level of water reduction that is being targeted, Michael and the team approached this challenge with the focus on reducing customers waste use of water.
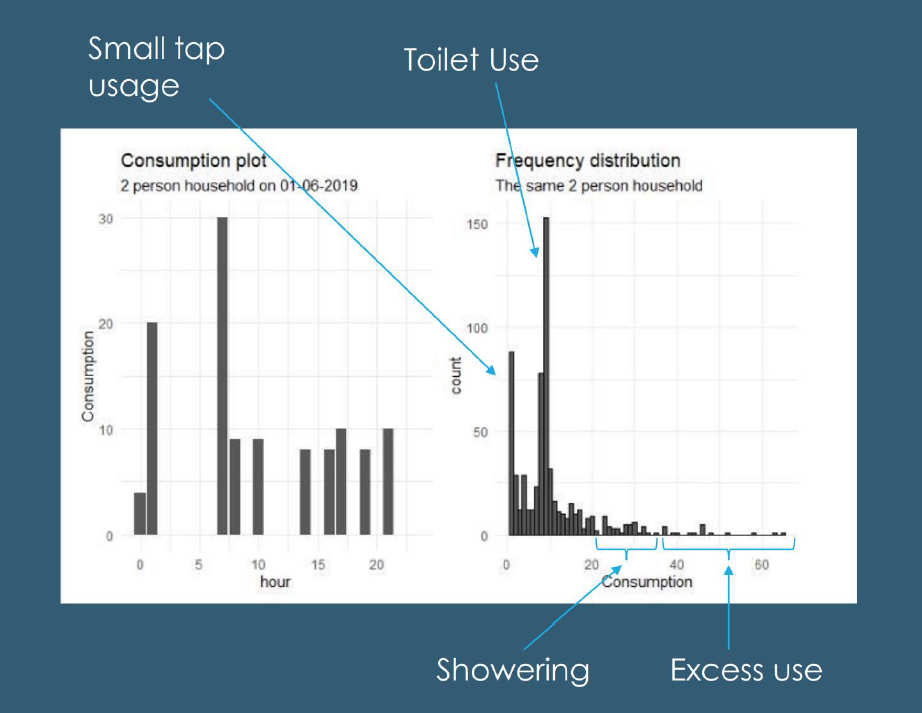
The first step in their approach was to answer the question – what is considered to be ‘excess use’? The team took raw data from a two-person household to look at an average day’s typical water use. From this, they were able to match behaviours to peaks on the graph as can be seen in the image below.

You can see that the activities with high levels of consumption, but low levels of frequency, can be identified as water being wasted and are the activities that are key to target to reduce water use.
By understanding the different ‘excess use’ patterns of different Acorn groups, this information can then be used to create personalised communications to customers to help them better understand their waste habits and to encourage them to consider alternative options. For example, being able to suggest a variable flush to reduce excessive water being used by toilet systems.
The team then proposed an app, ‘Pipedream’, to demonstrate how this would work. Using best practice from the energy industry as a guide, customers would be able to download the app and visualise their daily consumption against a set reduction target. The team also proposed adding options to demonstrate the change in water usage when different activities were chosen. For example, what happens to their water use if they decide to switch to baths instead of showers. This can then link into a reward scheme to encourage users in better water saving habits.
HOW ARE WATER COMPANIES APPROACHING THE CHALLENGE OF DEMAND MODELLING AND INNOVATION?
The roundtables also included discussion from representatives from other water companies sharing their views, examples of best practice and innovative ideas for future approaches to reducing consumption.
Points raised ranged from the importance of understanding the potentially contradictory view that larger households are naturally more water efficient than single person households (and how this can lead to flaws in using Per Capita Consumption (PCC) rather than Per Household Consumption (PHC) in demand calculations), to examples of how quality and timely communications have been proven to reduce water use.
Naturally conversations turned to Covid 19 and the clear evidence of changing behaviours and local demand, and potential ways in which this can be modelled and evidenced.
WHAT’S NEXT?
Look out for our next roundtable in the series which will be focussed on understanding the impact that Covid has had on financial vulnerability in the water sector.
Please do not hesitate to get in touch should you want to hear more!