Impact of turnover vs. footfall for shopping destinations in 2024

Footfall has historically been the go-to method for measuring a shopping destination’s performance, conducted through pressure sensor mats, light sensors tracking shoppers’ entry and exit movements, advanced camera systems and more. Although ubiquitous across the retail industry, only measuring the number of people entering and exiting a store misses important aspects of true store performance. The current pace of change in consumer behaviors demands that commercial landlords and occupiers know more about their performance drivers if they are going to thrive.
So, why is this the case? What do commercial landlords need to know about turnover and footfall to stay afloat?
How consumers’ changing behaviours towards shopping locations affect footfall
Since 2019, vendors across the UK have experienced an overall 11.5% drop in footfall. While this may sound like catastrophic news for retail destinations, the truth behind the headline footfall figures is perhaps surprising– an overall rise in consumer spending. Although a shift in consumers’ shopping behaviours is undeniably present, its impact may not be as profound as it seems.
Frequency has been a major driver of this, dropping by 31% over the last five years, meaning that consumers have been visiting shopping places much less often. However, the amount being spent by consumers when visiting shopping locations has climbed 29% over the last five years, counteracting declining footfall.
This increase in trip spending is not just an inflationary rise – the fundamental reason to visit and our behaviours on visits have changed as a result. Successful locations are those that are adapting to the new shopper landscape.
How consumers’ changing spending habits, values & “missions” affect footfall
What consumers are spending any disposable income on has also been changing. While retail conversion has remained relatively unchanged, there have been evident increases in Catering and Leisure conversions on the same trips, meaning consumers are increasingly combining a shopping trip with food/drink or a leisure activity. It is this combination of shopping, browsing, eating/drinking and leisure that has led to the overall increase in spending per trip.
These comparisons can be illustrated through what we at CACI call “missions” from our Shopper Dimensions dataset, which illustrate the trip someone is on at a given time, and attribute “missions” to the tangible actions someone takes once at the shopping destination, such as browsing, spending, time spent, etc., to assign a “mission” to each trip.
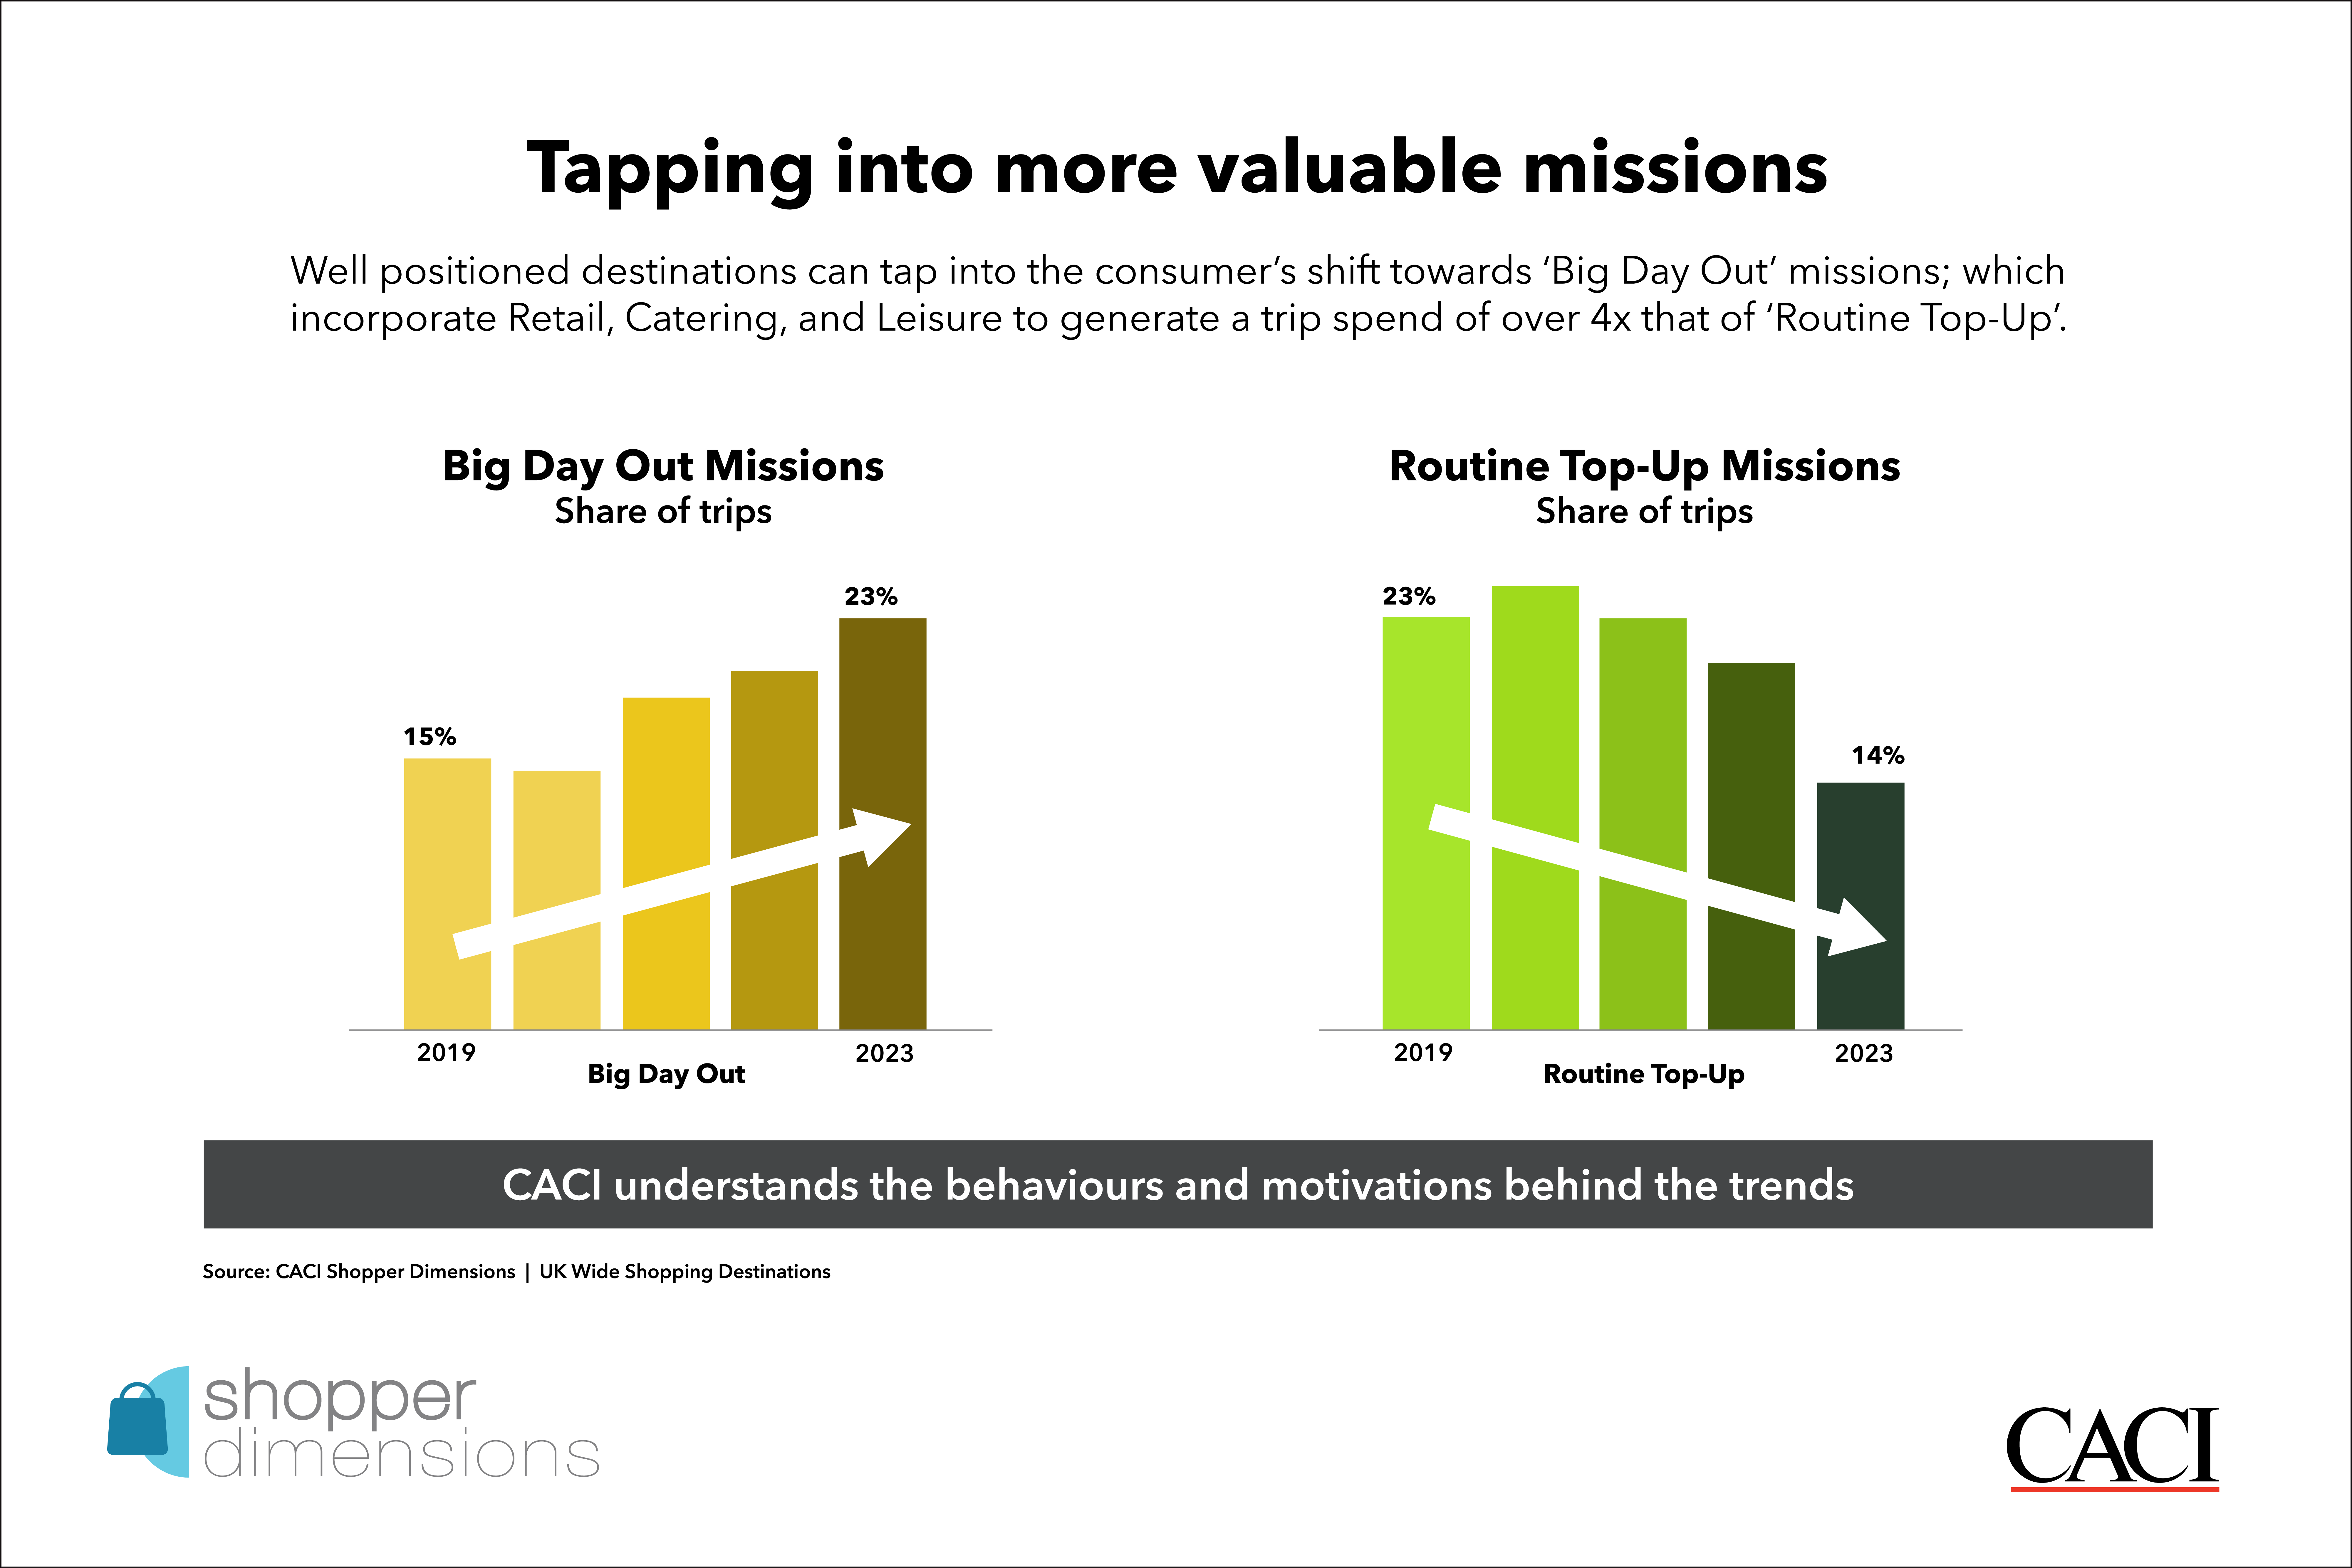
According to our findings, consumers are relinquishing their less engaged “missions” but concentrating trips around the “Big Day Out” trip. This is illustrated in the shifting profile of the top three missions in Shopping Destinations, which explains why a decline in footfall does not necessarily equate to declining spend. At a glance:
- “Big day out” missions are our more engaged trips. They may be less frequent, but they are ones where multiple retail stores are often combined with Catering and Leisure, resulting in a trip spend 2.4x the average mission. Since 2019, these missions have grown to 23% of all shopping missions.
- 37% of “spending time” missions have no purchasing associated with them. While they may contribute to footfall figures, they do not directly contribute to sales-through-tills. Having dropped off post-Covid-19, these trips are now holding flat at a lower shelf.
- “Routine top-up” trips are quick, functional and emotionally disengaged trips that a spend of just 47% of an average trip. These trips are dropping out of our repertoire and can be substituted online.

We can therefore see that looking in greater detail at the changing nature of the trips made provides a clearer understanding of commercial asset performance than simply tracking the overall volume of trips.
Key levers to conclude turnover & application methods to target growth outcomes
To make a meaningful impact in asset performance, commercial landlords must move beyond measuring just the number of visits and start reporting the different levers of shopping location spend.
While there are nuances behind the headlines that apply individually to each location, all spend at a shopping location can ultimately be boiled down to three key levers:
- The volume (number) of unique shoppers they have
- The frequency of consumers’ visits to a shopping destination
- The value that each shopper spends per trip.
Commercial landlords should consider applying the following methods to each lever to effectively target growth outcomes:
- Volume: Convert footfall (visits) into ‘spenders’ and target engagement strategies at driving scheme trial; measured by the percentage of the catchment population currently shopping with you (penetration).
- Frequency: Embrace the different role that your asset plays for different cohorts, diversifying the occupier offering to give shoppers more reasons to return on different missions.
- Value: Determine the highest spending shopper groups to target, segment customers and tailor offers to them to increase cross-shopping opportunities and drive value.
What does good look like?
Now is the time for commercial landlords to leave pre-pandemic comparisons behind. Footfall may be down overall, but the evolution of consumers’ shopping destination behaviour serves as a reminder that relying on the past as an indication of how assets should behave will not lead to longer-term success. If anything, these behaviours have demonstrated that the types of trips people continue to use shopping locations for are more engaged and valuable than ever before.
Our unique view into how and where consumers are spending has been made possible with the help of datasets like Shopper Dimensions, which enable KPI benchmarking of assets against similar locations across the UK and leverage transactional and data spend insights to enhance decision-making. We can help you calculate the impact of each shopper metric and the headroom compared to peers and catchment.
To find out more about what Shopper Dimensions can do for you and your business, speak to one of our experts today.