Challenging areas for the grey belt: London and the South West

In this final article in our grey belt series combining CACI’s housing demand data with VirginLand’s grey belt site identification, we take a deeper dive into two areas where the impact of the grey belt will be less obvious: London and the South West.
This is not to diminish the overall value of the initiative, but to point out that it is not the single answer to the UK’s housing challenges. To be most effective, grey belt reallocation should be considered alongside other mechanisms to accelerate housing delivery such as brownfield, infill, repurposing and urban regeneration.
How will the grey belt initiative affect London?
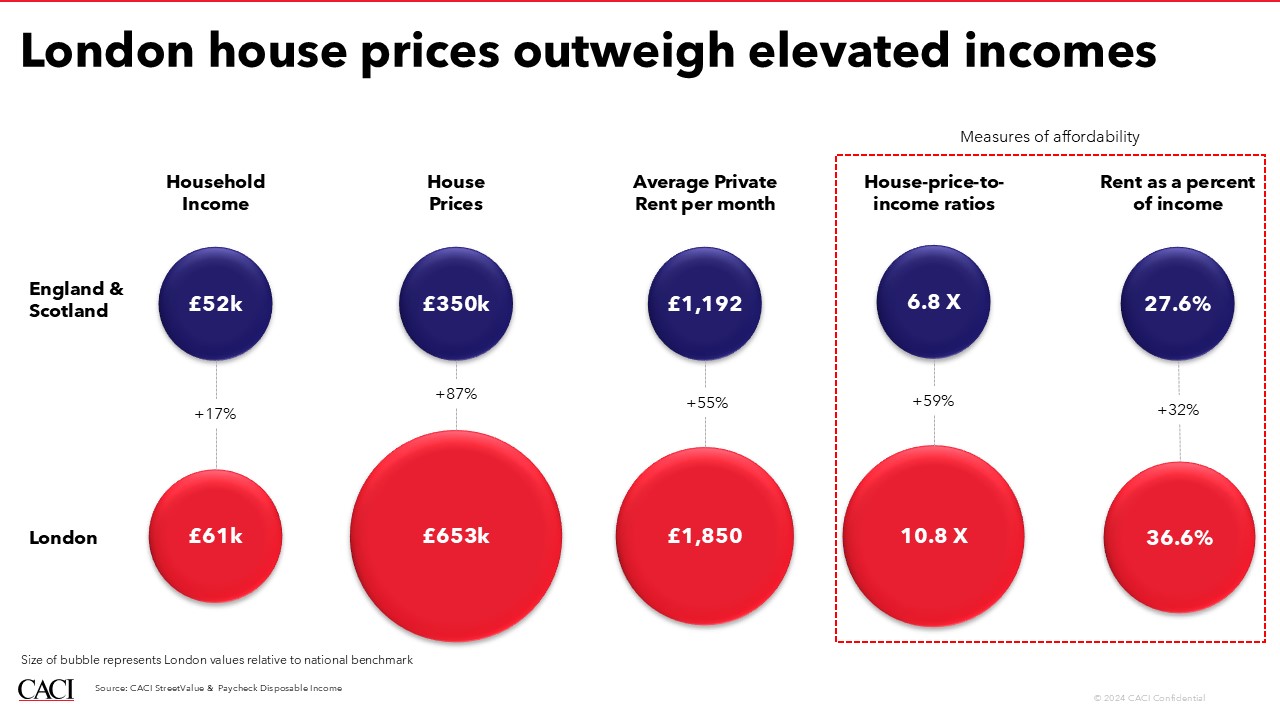
Home to over 7 million adults, London is by far the most densely populated region in the UK. As a result, demand for housing is particularly acute in the capital and the conversation is dominated by affordability. It’s easy to see why; house prices are 11 times the average household income, and private rent is 37% of income. Although households in London earn 17% more than the national average, these high prices mean that homes are 59% less affordable to buy and 32% less affordable to rent.

In this context, any initiative to increase the overall supply of housing in this region is welcome; particularly if it’s targeted at the more affordable end of the scale. So, what impact will the grey belt have in London?
Although home to 14% of the population, London can house just 0.4% of all grey belt homes – a total of 1,955 dwellings across 31 sites. This is not for want of green belt (22% of the London region, by area, is currently designated as green belt), but for want of suitable locations that could be re-designated. Analysis by VirginLand shows that just 0.2% of the available green belt land is likely to be reallocated grey belt, with much of the London’s green belt holding additional designations like Designated Open Space, Country Park, Woodland or Nature Reserve and Conservation Area and Grade 1-3b agricultural land grades.
The challenge in London is also compounded by the location of the sites relative to movers. Being on the outskirts of the urban sprawl, just 11% of all London home movers live within the catchment of the identified sites; roughly 192,000 individuals. Although more than enough to absorb any new homes delivered, the scale of movers puts into perspective how limited the impact would be on demand; if all sites were built out to their fullest, there would be 98 movers for each home.
While there is little doubt that the 31 identified locations would be additive to the overall housing stock, the question is over how much of an impact these limited sites can have on a particularly strained market. With the population set to grow by another 6.1% in the next 10 years, London will need other initiatives, alongside the grey belt, to accelerate housing delivery in more urban neighbourhoods.
How will the grey belt initiative affect the South West?
Just 4.5% of the South West is designated as green belt, well below the national average. It therefore follows that grey belt opportunities in the South West will be similarly limited, and just 228 potential sites have been identified with the combined potential to deliver 11,868 new homes.
While this is not an insignificant number of homes, it represents just 2.2% of the total grey belt opportunity spread across 9.4% of the population. The location of grey belt sites also limits the initiative’s regional impact, as just 18% of the 1.6 million potential South West movers live within the grey belt catchment, against a national average of 36%.
Although limited in scope for the region as a whole, there are some pockets where the grey belt will be more impactful, and the characteristics of the catchment movers in these locations point to the type of homes that should be prioritised.
With concentrations of sites close to urban populations in the likes of Bristol, house-to-earning ratios and rent-to-earning within the grey belt catchment are higher than those outside of it (7.1 times income and 27.4% of income respectively). High concentrations of Family Renters, Tenant Living and Cash-Strapped Families within this catchment, and relatively large sites averaging 1.7 hectares, suggest a particular opportunity to deliver larger mixed neighbourhoods with high levels of rental product.
As with London, the grey belt initiative has the potential to support some of the housing needs of the South West, but an overarching housing strategy for the region should also be mindful of the 82% of home movers that live outside of the grey belt catchment.
How CACI can help?
To learn more about how you can ensure that your developments are meeting the demands of local movers, contact CACI.
Missed the previous blogs? Find the links to the series so far below:
How grey belt sites will help tackle the UK housing crisis – CACI – Tolga Necar
Grey belt sites: what they are, locations & impact on housing – CACI – Steve Norman and Sam Bedford, Virgin Land
Assessing the impact of the grey belt initiative on a National scale – CACI – Tolga Necar
How will the grey belt initiative affect North West England & Scotland? – CACI – Tolga Necar