All you needed to know about the UK Census | CACI
Share this article
What is the census and what is its purpose?
First launched on 10 March 1801, the UK census is a decennial questionnaire undertaken by the Office for National Statistics (ONS), National Records of Scotland (NRS) and Northern Ireland Statistics and Research Agency (NISRA) that asks a variety of demographic questions on age, sex, marital status, health, education, and housing.
The primary purpose of the UK census is to build a detailed snapshot of society at that current point in time. Helping national, regional, and local governments understand the people and households in their constituencies. This allows these government agencies to develop current policies or create new ones, as well as plan and fund services, including education, medical facilities such as doctor’s surgeries and hospitals, and transport infrastructures such as roads and new train routes.
The census is also used for other purposes, helping organisations and companies understand the society they interact with. This includes:
- Voluntary organisations using census data as evidence to support any applications they make for funding.
- Academics and Education Institutions use census statistics to support research that they are working on.
- Businesses using census information to help them understand their customers more effectively, i.e., a retail chain might use census population data to help decide where to open a new store.
How often is the UK Census, and when is the data released?
The census is run every ten years and typically collects information from the public in the first quarter of the calendar year of the decade. ONS for England and Wales, and NISRA for Northern Ireland had a Census Day on 21 March 2021. However, on 17 Jul 2020, NRS recommended to Scottish ministers that the 2021 Scottish Census be moved to 20 March 2022 due to the COVID-19 pandemic.
The responsibility for running the UK censuses is split between ONS, NRS and NIRSA based on their geographic region. The Office for National Statistics hass overall responsibility for publishing census records and statistics for the whole of the UK.
The data from the census is typically released in phases. For instance, in the first phase for England & Wales, local authority level population and household estimates were released, in June 2022. The three census offices each have their own timetable, with outputs staggered across a period of one to two years.
Because Scotland’s census took place a year after the rest of the UK, reference dates will differ. This will impact the comparability of UK census data, for this version.
Due to this, the three census offices are working closely to develop UK-wide census records, which involves consideration of how best to meet the challenges around comparability, coherence, timeliness, and accessibility of the information.
Below is an approximate timeline of the different subject releases based on the various census offices.
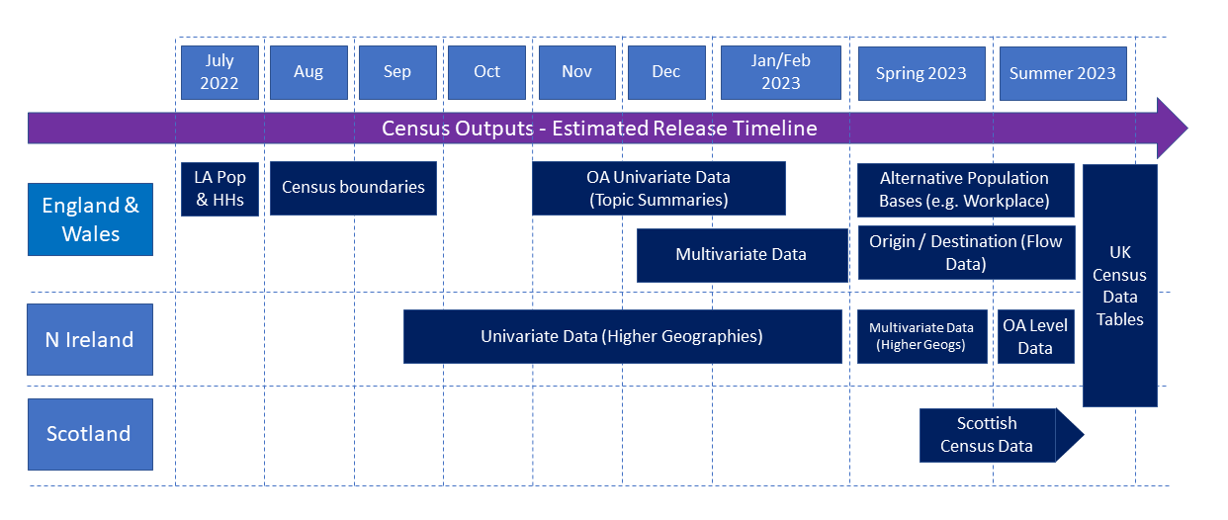
KEY
LA POP – Local Authority Population Data
HH – Household Estimates
OA – Output Area
CACI and the UK Census
CACI has been processing, analysing, and modelling Census data since 1976, when we became the first Census Agency in the country.
The data from the UK census is used as input for many of CACI’s products, including Acorn, Address Spine, Ocean and Fresco. A wealth of companies uses these products, public sector bodies, charities, and not-for-profit organisations to help them understand their current customers, constituents, or beneficiaries more effectively, as well as market their products and services to like-minded individuals that fit the same demographic profile of their existing customers, saving them both expenditure and resource.
We also use the census as the baseline for CACI’s annual Up-to-Date Demographics release, which provides the latest estimates of key census variables (e.g. age, housing tenure, presence of children). These are modelled forward using various, more frequently updated data sources. As the census is carried out only once every ten years, this provides an increasingly more reliable view of the population than the census data itself. Up–to–Date Demographics is available at census output area level. Consistent with this and for even more complex use cases, our annual Population and Household Estimates and Projections provide counts down to individual postcode levels and project forward for future years.
The first results of Census 2021 were published on Tuesday, 28 June 2022. These provided estimates of the number of people and households in England and Wales at local authority level. From this data, CACI was able to provide insight into the data to help:
The Ageing Population – The ageing population shown by this census follows our own predictions very closely, so it comes as no surprise. It does however throw up two significant questions. Firstly, what does this mean for pensions? With proportionately fewer working people to retired people, will there be a greater emphasis on private pensions to cover the state shortfall? And secondly, what does this mean for senior living facilities? We’ve recently been pushing the message that senior living needs to be looked at more rigorously in terms of its role within the wider housing stock and that all types need to be taken seriously. The 2021 census only serves to vindicate that, and we would encourage local authorities and senior living developers or providers to engage with the data now to understand what their existing and future residents need, to ensure we have a fit-for-purpose housing mix for an ageing population.
Regional Growth and ‘Levelling Up’ – It is great to see regions other than London taking the top spots in terms of population growth. It finds itself behind the East of England and South West, and in joint third place with the East Midlands, in terms of percentage increase. More noticeable for their omission from the top of the charts are those regions further from London. Wales, the North East, and Yorkshire and The Humber are lagging behind quite significantly in terms of population growth, suggesting that the pull of living within reasonable commuting distance of London is still strong. Salaries of course have a big role to play – the closer you are to London the higher both salary and disposable income tend to be. The growth we’re seeing in the census is more or less restricted to the southern part of England, so there is clearly a lot of work to be done with the ‘levelling up’ agenda, to entice people further away from the capital.
New release
On Wednesday, 2 November 2022, ONS also released their Demography and Migration Data for England and Wales, their second release of Census 2021 data as part of their topic summaries.
This includes an update to population and household estimates for England and Wales, which now includes unrounded data by sex and single year of age, providing even more detail on individuals who were previously in age bands. This meant that on Census Day, the size of the usual resident population in England and Wales was 59,597,542, which was the largest population ever recorded through a census in England and Wales. This meant that the population grew by more than 3.5 million (6.3%) since the last census in 2011 when it was 56,075,912.
It also contains information on household and resident characteristics, including household size, composition, deprivation status, and people’s marital and civil partnership status. Providing detailed insight into the makeup of the 24.8 million households across England and Wales. Such as although the number of households has increased to 24.8 million (up 6.1% from 23.4 million in 2011), the average household size in England and Wales in 2021 was 2.4 people per household, which is the same as in 2011.
Migration data is also included in this release providing further information on country of birth, passports held and year of arrival, helping us to understand internal and international population changes. For instance, of the 3.5 million (6.3%) increase in population from 2011 to 2021, 57.5% is positive net migration (the difference between those who immigrated into and emigrated out of England and Wales).
Additional Information & Resources
ONS (England and Wales) – https://www.ons.gov.uk/census
NRS (Scotland) – https://www.scotlandscensus.gov.uk/2021
NISRA (Northern Ireland) – https://www.nisra.gov.uk/statistics/census/2021-census
UK Government Census Whitepaper –https://assets.publishing.service.gov.uk/government/uploads/system/uploads/attachment_data/file/765089/Census2021WhitePaper.pdf
Share this article