Over the last three years, we have seen a more significant shift in consumer habits than we could have imagined. Currently challenged by the rising cost of living and an economy in recession, the post-pandemic spending bubble was cut much shorter than initially anticipated by economists.
Like everyone in January, CACI reflected on the last few years, and as part of this, we revisited predictions that we made during the height of the Covid-19 pandemic. Consumer behaviour changed significantly in the space of several days, triggered by widespread temporary store closures during the lockdowns. Some stores were never able to reopen; whilst online platforms boomed, in light of these significant behavioural shifts, CACI rebuilt predictions to reflect this new normal.
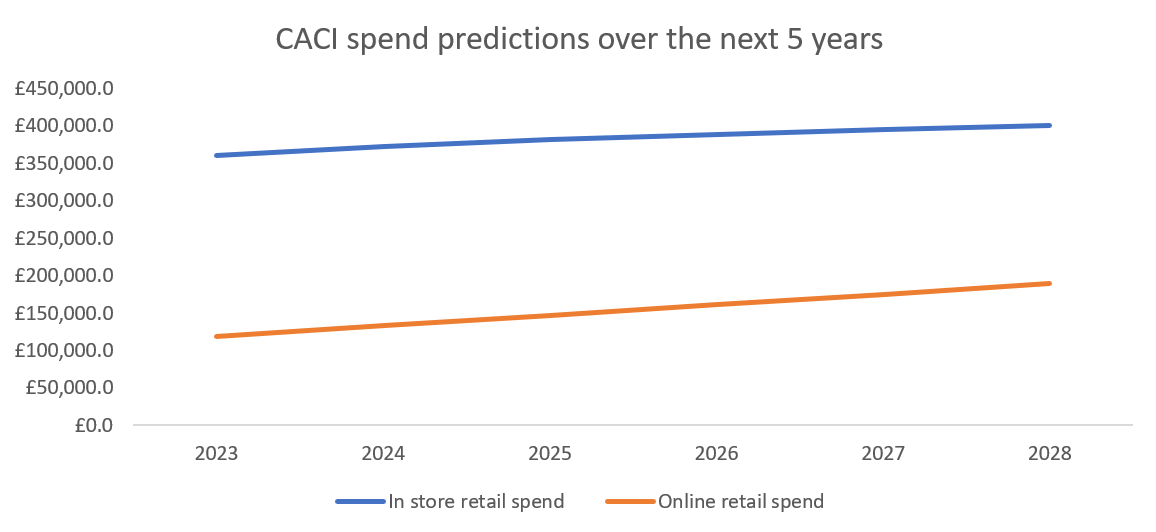
How close were CACI’s consumer online spending predictions to actual results?
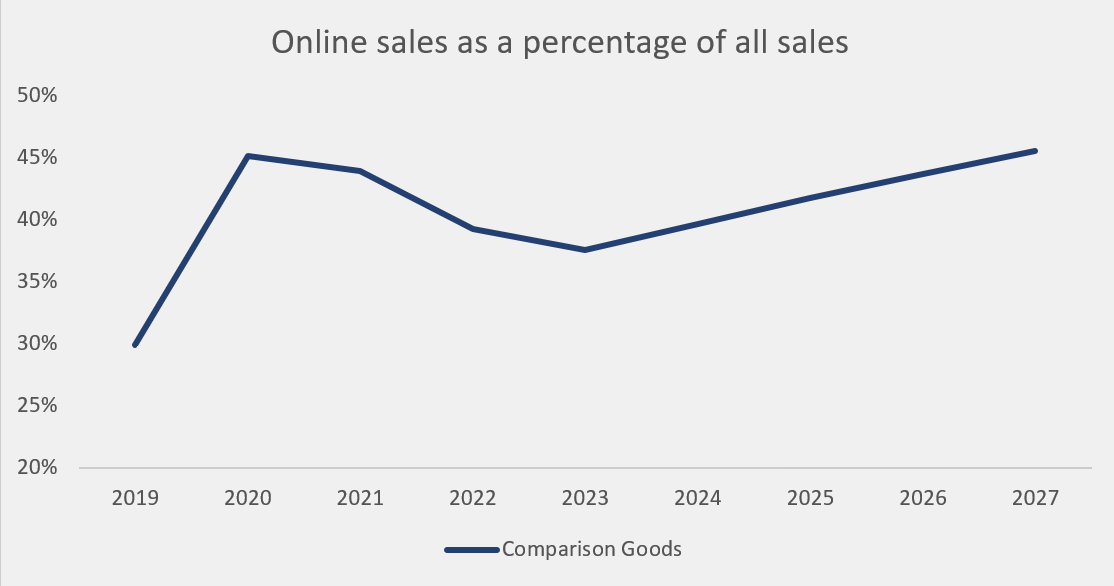
Mirroring our spend predictions, a phrase we maintained at CACI at the time was that “online spend jumped forwards five years in one month”. What we have come to realise was that three years on, these spend predictions, shown in the below chart, highlighting a return to in-store, were very close to the true picture.
How can CACI track consumer online spend behaviour?
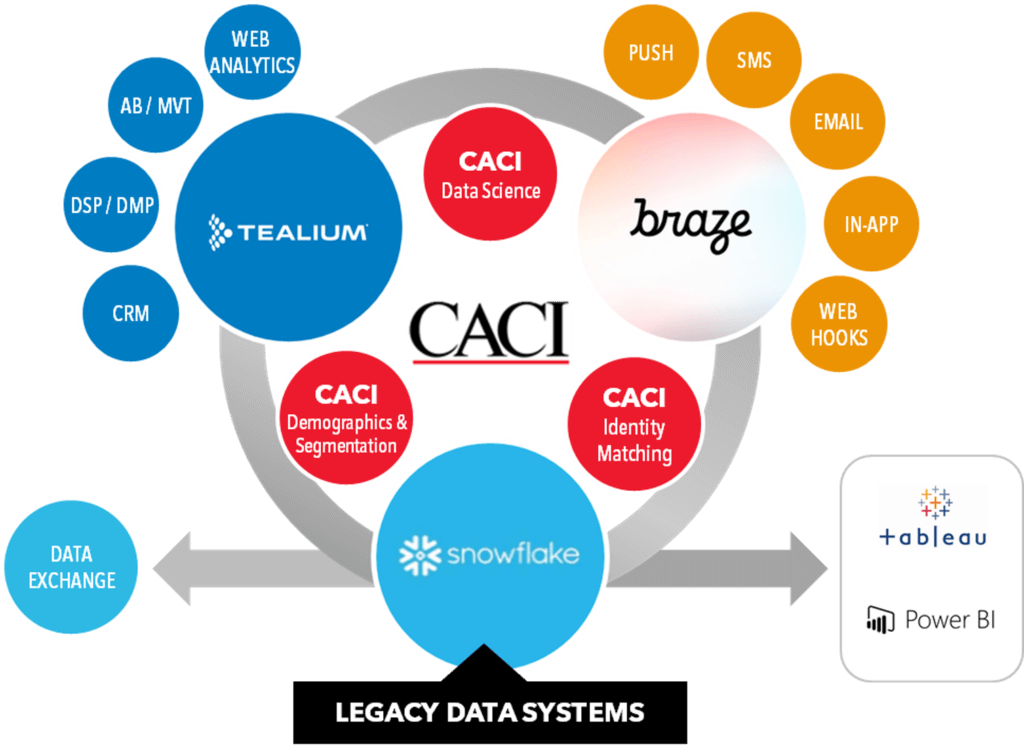
CACI can unpick these new trends in spend behaviour using our new and exciting tool kit of Spend Dimensions and Brand Dimensions, which tracks over 200 shopping centres and 300 brands across the UK.
What we can see demonstrated in the above chart is a post-pandemic slump in online spend as a proportion of total spend. In 2023, online spend falls to 38%, before gradually rising again in the preceding years.
Whilst the current split in online and offline engagement provides us with an overall national average, it is important not to expect all shoppers to follow suit. We have seen asset type, product category, brand, region and demographics all play a big part in the extent to which a shopper might engage online.
Who is most likely to shop online?
Demographically, the split between those engaging in-store and online has become less distinct, highlighting the closing of the digital gap between young and old, with the difference between online market share across all groups dropping from 10% to 5% over the last year.
However, the big picture doesn’t change. Key online shoppers continue to be younger shoppers across the affluence spectrum as well as more affluent shoppers, likely driven by greater access to e-commerce platforms and the ability to afford delivery costs.
How does this vary by product category?
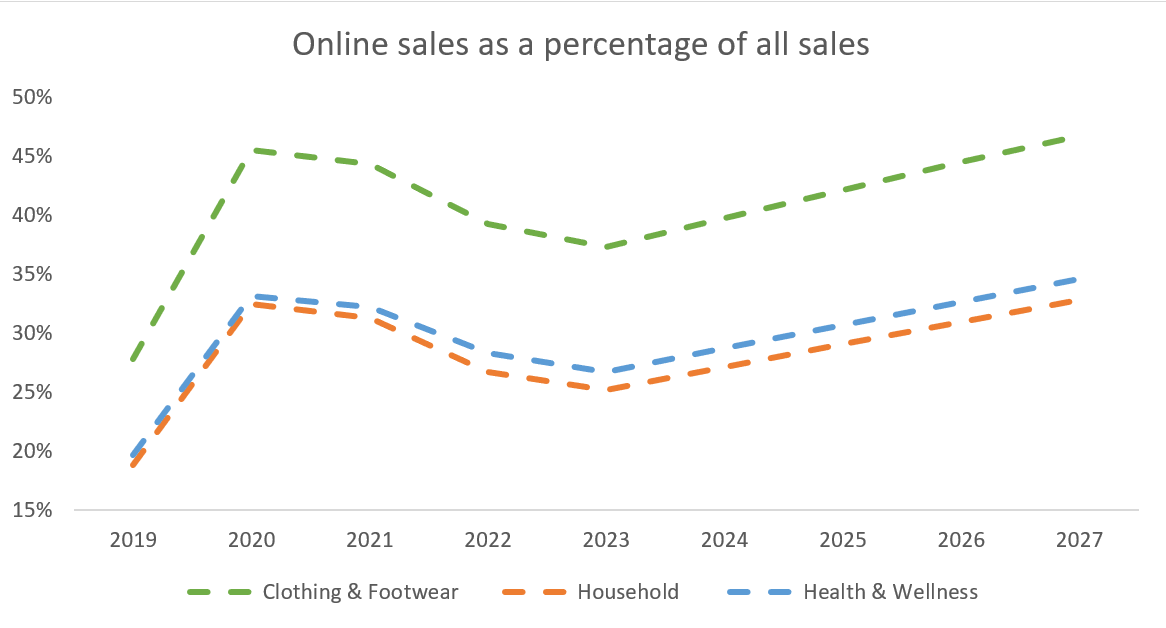
The recent shift back towards in-store engagement isn’t clear-cut and does vary by product category. CACI expectations were that the drivers of the overall return to the store would be clothing and footwear, household and health & wellness brands. This has been the general spend trend that we’ve been seeing across the UK since 2020.
The variation by category gets further exacerbated by the time of year. For example, comparing the months of October to December 2021 and 2022 in the chart below, there was a clear shift for household and kids’ goods spend to in-store, likely driven by the desire to experience before purchasing. Whereas, General Retail painted an interesting picture within the final quarter of 2022. Both in 2020 and 2021, with Black Friday and Cyber Monday taking place in November, Christmas hit online earlier than in-store, boosting online’s share of the market temporarily. In December, our Christmas survey reiterated this sentiment, with over half of those shopping online citing a main drive of this being concern with the rising cost of living and saving money, whereas over half of those shopping in-store did so for the experience. The experience-focused, in-store shoppers drove the resurgence year-on-year of in-store spend in December.
What does the return to in-store mean for retailers?
Across the 300 brands we tracked, many pure online brands are experiencing a decline in market share, in-store brands have typically performed well, and those blended brands have seen a shift towards a greater in-store market share. The power of the store can be seen through brands such as Decathlon, Nespresso, Build-A-Bear and Denby, who have all shifted to greater reliance on the store over the last quarter. In comparison, online disrupter brands such as Vinted and Shein which thrived through the year began to see a drop off.
What does the future of consumer online spending behaviours look like?
Whilst 2022 did represent a return to bricks and mortar, we are still at least a year ahead of where we would have been if the pandemic hadn’t happened. We expect to see continued growth in both on and offline retail spend, although proportionally online spend will increase.
However, it is undoubtedly true that we are currently, and will continue to, experience unexpected macroeconomic challenges which will impact different brands and destinations in different ways. Brands can no longer rely on their name as we have seen with the casualties of too many well-known landlords and retailers. Therefore, making informed decisions through the use of CACI data will help retain a competitive advantage and stand out from the market.
To learn more about how CACI can help your brand navigate changing consumer spending habits, get in touch with us here.