How online shopping is changing the habits of UK consumers

As part of our series delving into the UK’s shopping habits, we’re looking into online shopping and click and collect – and how bricks-and-mortar retailers and landlords should respond.

Shopper Dimensions, our aggregated database of over 600,000 interviews with shoppers at leading UK retail centres, has revealed several significant shifts in shopping behaviour.

Here, we’re exploring an important question for retailers and landlords alike: how is online shopping and click and collect changing the behaviours of UK shoppers – and does it present a new opportunity?

The Rise of Click and Collect

Online spend has grown an average of 14% each year since 2013, and it shows no sign of slowing down. Between 2017 and 2026, we anticipate that the amount we spend online will grow a further 127% in total.

the growth of click and collect

This growth can arguably be attributed to convenience, as retailers invest more in multichannel approaches, offering increasingly diverse and convenient ways to buy. For both the retailer and their customer, the line between physical and online has blurred – for some demographics it doesn’t exist at all.

Previously the playground of high street giants, click and collect is increasingly standard for smaller retailers too, with those not offering collection or home delivery finding themselves the minority. Online shopping has created a culture of ‘now now now’, with consumers expecting retailers to keep up with their desire for immediacy.

Online shopping has created a culture of ‘now now now’ with consumers expecting retailers to keep up with their desire for immediacy

Next-day (and even same-day) delivery, collect immediately in store, and buy-now-pay-later options are becoming the norm, as retailers compete on convenience as well as price. And this is where click and collect provides an opportunity for physical retailers.

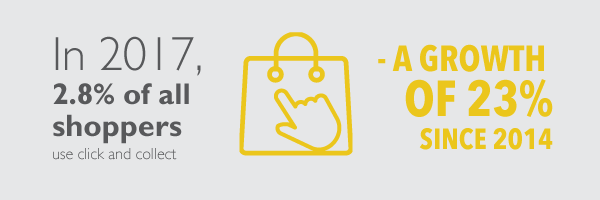
In 2017, 2.8% of all shoppers we interviewed were using click and collect services during their trip – a growth of 23% since 2014. Someone using click and collect is worth 90% more on a shopping trip than someone who isn’t. It’s important to note that, where click and collect was previously almost exclusively in-store (and therefore in-centre), it’s now offered through a variety of channels. A rapidly developed network of Collect+ points, self-service delivery lockers and supermarket collection options has likely diluted true popularity of the service.

The Click and Collect Opportunity

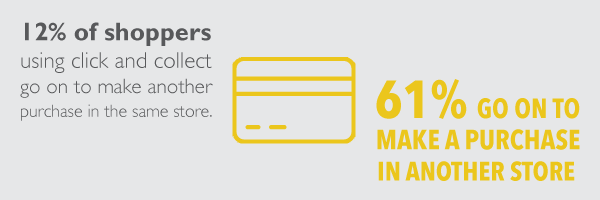
Though click and collect poses logistical and operational challenges for retailers, and potentially reduces rent for landlords, it actually presents a significant opportunity for in-store conversion. Our research found that 12% of shoppers that collect in store go on to make another purchase in the same store – and, interestingly for centre owners, 61% go on to make a purchase in another store in the same retail centre.

click and collect users

In particular, we believe that – as click and collect becomes more ingrained in the everyday shopping experience – local retail centres that provide fast access to practical everyday essentials will have a key opportunity to cement themselves as vital parts of retailers’ multichannel strategy.
For retailers, the next steps are simple: taking advantage of the conversion opportunities offered by click and collect sales means making the purchasing process as simple as possible – and ideally, taking the complexity out of returns, too.

Much like click and collect, using physical centres to simplify the onerous returns process gives multichannel retailers the opportunity to steal a march on digital and bricks and mortar competitors alike – increasing centre footfall and conversions in the process.

Discover More

If you want to hear more about how CACI’s Property expertise can help you, get in contact now.

Who are Londoners and how do they shop?

Who are Londoners and how do they shop?

Greater London is just over 40 miles wide yet has a larger population than Scotland & Wales combined. The capital makes up 13% of all retail spend in the UK and has a significant overrepresentation of the country’s most affluent urban demographic groups.

People often talk about London being its own bubble, and Londoners’ behaviour certainly reflects that. London consumer behaviour is unique and reflects the extensive supply of retail, catering and leisure compared to anywhere else in the UK.

CACI research sheds some light on just how different the London consumer is, both demographically and behaviourally, compared to the rest of the UK.

Polarised London

London’s demographic profile is the most polarised in the UK; there are more of the country’s most affluent demographic groups, as well as the younger affluent groups, but there are also high volumes of the least affluent members of the country.

What is Acorn?

Acorn is a geodemographic segmentation of the UK’s population. It segments households, postcodes and neighbourhoods into 6 key categories, 18 groups and 62 types. By analysing significant social factors and population behaviour, it provides precise information and an in-depth understanding of different types of people.

The younger and affluent consumer groups have the most significant impact on London shopping locations. They are in abundance, they have money to spend, they are brand conscious and they are constantly seeking experience. It is the way these shoppers interact with a centre which ultimately shapes the London retail and catering landscape.

london-demographic-profile

To help quantify the scale of wealth of some of London’s key Acorn groups, CACI compared house prices and income in London to their counterparts elsewhere in the UK. For example, Lavish Lifestyles have an average house value of £3.8m with savings and investments in excess of £100k. City Sophisticates, the most prevalent group in London, live in houses valued at £1.5m on average and incomes 56% higher than the UK average. At the other end of the scale Struggling Estates feel the brunt of London house prices, more likely to be renting accommodation with a not-so-modest value of £426k, paired with an average income -22% lower than the UK average.

The Promiscuous Shopper

London shoppers have a higher frequency of visit compared to the UK average. This is a function of the nation’s capital having everything on their doorstep which means that they can be promiscuous in where they choose to shop. For example, in a week it is possible to pick up some jeans in Shoreditch, collect groceries on the way home to Brixton and stop by Oxford Street the next day to get a top to match the jeans from yesterday.

London-shopping-frequency

This is why average retail spend per trip sits marginally lower in London than the rest of the UK (-6%), but when you consider their behaviour over the course of a year they are more valuable shoppers given the frequency in which they engage with retail. As ‘nownownow’ consumers they expect retailers to keep up with their needs and expectations.

A Culinary Scene

The most defining trend shaping Londoners’ consumer behaviour in the past year, is their propensity to spend on catering. Londoners’ average catering spend during Christmas peak season is 56% higher than elsewhere in the UK, despite their smaller party size. This is partly attributed to the abundance of cash rich, time poor consumers (e.g. frequently grabbing some breakfast or lunch while on the go), but it is also a function of post-work time routine, where dining out and experiencing London’s ever-growing culinary scene is becoming an embedded part of London culture.

London-average-catering-spend

This is especially true amongst young, professional groups who dominate the London demographic and are key users of the evening economy. The older affluent groups, who tend to live on the outskirts of London, are less likely to engage with the post-work offer given they are more likely to be tied to catching trains home. As such, these groups are much more likely to be found utilising the ever-growing grab ‘n’ go culture during the day.

What This Means

London has been and will always be a driver of innovation across multiple sectors and channels. There is a need to adapt quickly and smartly to cater for an increasingly demanding consumer; recognising the differences and intricacies between the different demographic groups is key. Staying on top of this is challenging, but those who keep up with the pace will continue to reap the greatest rewards.

If you have any questions on how customer insight can help your business, please get in touch.

If you want to hear more about how CACI’s Property expertise can help you, get in contact now.

What Can You Expect To See In InSite 8.8?

What Can You Expect To See In InSite 8.8?

Get Data

We’ve simplified the way you get your data into InSite. Currently working in tandem with File Import, Get Data is a two click process – select your file and if you’re happy with how InSite has interpreted the data press Finish and that’s it.

The exciting thing is now InSite remembers where the file came from and its structure. So should you update the original file, simply click “Refresh” and the data in InSite will be updated. Additionally, if your file is constantly updated, InSite can update itself every time you go into the system giving you an almost live link to your data.


Find Location (Gazetteer)

Setting up your own gazetteer to use on your own data is now much easier via the Find Location application.

HTML Mapping

Since the introduction of HTML mapping in InSite in 2019 we have updated the features with every release. In InSite 8.8 you can now export layers with images and logos.

We have also removed the limit on the number of layers you can have on a map (the only limit is the size of your available disk space).

Other Improvements

Duplicate your browse and map windows to test expressions and/or colour schemes without affecting your original files.


Add a thematic layer to your maps directly from the data tree.

Address level profiling now available using PAF’s UDPRN or OS AddressBase’s UPRN.

FFP (Field Force Planning) has seen quite a few improvements to enhance the user experience and map displays.

Spatial Modeller has had a small face-lift to improve the user interface and experience.

Under the hood speed improvements (e.g. to create a dtx for the whole of the United States used to take a few hours – it now completes in 5-10 minutes).

To upgrade to InSite 8.8 or if you would like more information on these new features and improvements or would like a demonstration please get in touch with your account manager.