Understanding electric vehicle demand

Understanding electric vehicle demand

Understanding EV Demand

The steady growth in sales of Electric Vehicles (EVs) has been one of the few good news stories in the UK New Car market over recent months.

Almost all the major manufacturers have at least one EV model or are bringing one to market at some point in the next 12-to-24 months. But despite Battery Electric Vehicles (BEVs) being regarded by many as the only future for sustainable mobility solutions and the much-publicised Government target for zero emissions by 2040, the market is still comparatively small.

The Society of Motor Manufacturers and Traders figures show Battery and Plug-in Hybrids account for 2.7% of the 2019 New Car market to date and in total BEVs still account for less than 1% of all cars on the road.

And this presents an interesting challenge for Automotive Network Managers and Product Planners – how do you understand geographical demand for your models in an embryonic and sporadic market? The “traditional” approach of following the market through TIV (total industry volume) can’t be reliable when the volumes are still so low.

It stands to reason that demand for EVs will be determined by three main factors and each of these will vary geographically:

  • Consumer demand – who is likely to want to buy an EV?
  • Accessibility – how easy is it to own and operate an EV?
  • Wider “Push Factors” – external initiatives to increase awareness, consideration and ultimately purchase of EVs

At CACI we think that taking a data-driven and largely customer-centric approach to these questions can help the industry understand how and where to effectively target EV opportunity.

Consumer Demand

So who is buying EVs? In the early days of EV deployment it was often assumed that the younger urban sophisticates would lead the charge (no pun intended) for EV take-up. But there was always one glaring problem with this assumption – these people don’t buy cars!

Instead, anecdotal evidence suggested that EVs have been particularly popular with older rural customers. To some that might seem odd but if we think about it, it makes sense. These customer types are more likely to have lower mileage or infrequent usage patterns so any concerns about range become less relevant. The more affluent rural types will likely live in larger properties, so they have space for a private chargepoint. And research suggests that typically they are more likely to favour function over performance for their driving experience – although most EV models offer as good performance as their petrol/diesel counter-parts for many there is still a perception of a drop-off in this regard and for some types that can be an important factor in the consideration to purchase.

Of course, this isn’t to say that all EV customers are older rural types – far from it – but it is an example of how we need to think harder about the different motivations and characteristics of an EV customer and how this can help us understand demand.

Consumer Characteristics

So what are the likely consumer characteristics and motivations? I would say the top 3 are:

  • Higher disposable income (the price-point of EVs is higher than their petrol/diesel equivalent)
  • Lower annual mileage or likelihood to own two or more cars (so EV can be the second or even third “run-around” car)
  • Increased awareness of environmental issues and a desire to reduce environmental impact

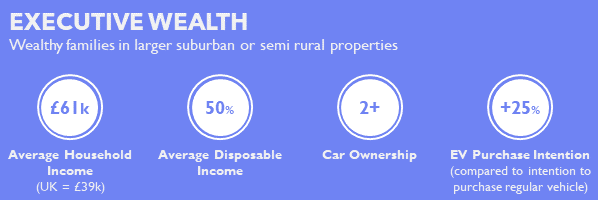
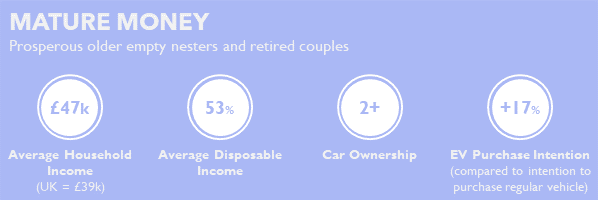
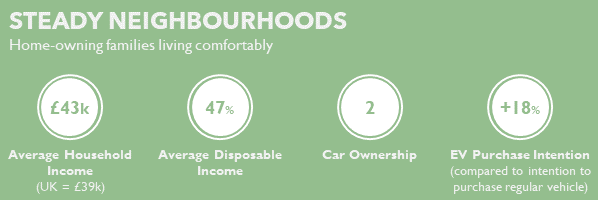
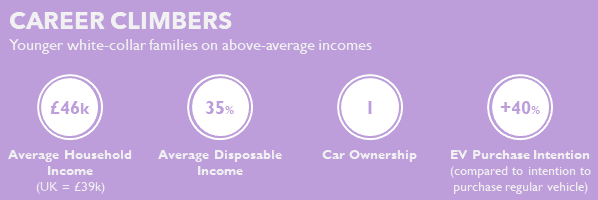
CACI’s research using Acorn and Kantar’s Target Group Index (TGI) shows those who have purchased or are considering purchasing, have many of these distinct characteristics, not least the prevalence among the more affluent Groups, particularly the older ones (Executive Wealth, Mature Money, Steady Neighbourhoods) but also the younger ones too (especially Career Climbers).

What is Acorn?

Acorn is a geodemographic segmentation of the UK’s population. It segments postcodes into 6 key categories, 18 groups and 62 types. By analysing significant social factors and population behaviour, it provides precise information and an in-depth understanding of different types of people.

Panel research data can be used to identify consumer groups most likely to want to purchase an EV. Acorn can then be used to link this “purchase intention” to the UK population to quantify demand and also geographically target specific local markets. This answers the critical questions of: Who? How many? And Where?.

But understanding the profile of a “typical EV customer” will only get us half the way. Already, there is likely to be a difference between those who go for the more aspirational models such as Tesla, Mercedes EQC or Jaguar I-PACE and those who want the more affordable models such as Nissan’s Leaf, VW’s E-Golf or MG’s ZS EV. And the profile will change further as more and more models come to market at all levels of the price-point spectrum.

The great thing about the customer-centric approach is it can be tailored according to the model. By understanding which Acorn Types are most likely to take-up a specific EV, the size of the demand (and how best to reach them) can be established.

Below are 4 example Acorn groups classifications and their EV profiles:

Still, even after accounting for this, arguably it is just one side of the equation…

Accessibility

The motivation and means to purchase an EV is only one factor. The ability to own and operate one is also crucial and this leads to the critical question of charging. Most surveys of customers find that concerns about range are top of the list of factors that might dissuade from purchasing an EV. Some manufacturers have taken innovative steps to help customers get over this hurdle, such as Mercedes’ “EQ Ready” App which tracks your driving behaviour and tells you how much charge you would have left at the end of the day if you were in an EV. But nevertheless, access to chargepoints will be seen by many as a crucial factor in their decision to purchase.

Public chargepoints are becoming more and more available but their distribution does vary considerably. Measuring the provision of public chargepoints in an area is becoming easier as more data becomes available, some free to use (such as the National Chargepoint Registry or openchargemap.org), others on an annual license (such as ZapMap). And they reveal some interesting patterns in the provision of chargepoints. For instance, using NCR we can see that three of the Top 10 Local Authority Districts by number of chargepoints are in the North East.

But again, measuring public chargepoint accessibility in an area is only one part of the equation. Almost all EV owners will want to have private charging facilities at their own property. Very few would savour having to run a charging lead out of their front door or living room window onto the street. So while there are schemes, such as in Brighton, to provide chargepoints in lamp posts for those without, for the majority it is safe to assume that private off-street parking is an essential requisite.

No comprehensive dataset of private chargepoints exists yet, but there are ways we can measure how many properties have the capability to install one. The simplest of these would be to assume that a certain proportion of semi-detached and detached properties would have a drive-way and then use Land Registry data to quantify those, further narrowing it down by their freehold status. And a blended data approach could be taken to overlay the number of private vs rental properties (although some landlords might see having a chargepoint as an attraction in a crowded market).

A more sophisticated (and therefore expensive) approach would be to use GIS data to identify individual property footprints that are a sufficient distance from the road to indicate a driveway (or garage) and therefore space to install a chargepoint. One can also imagine satellite imagery and remote-sensing techniques being used to good effect here (albeit at a cost that might outweigh the benefit of the accuracy).

It is true that both these approaches will miss some things, for instance shared chargepoints in private parking for flats, but they still provide a good “all things being equal” measure of capacity.

Perhaps the most exciting developments will be with the employment of AI and machine learning to utilise resources such as Google StreetView to “spot” chargepoints and quantify. One can imagine many applications for this outside of the Automotive industry (again where the benefit might outweigh the cost).

And this data-driven approach can be future-proofed too. The Government is considering policy to make every new residential property with an associated parking space be fitted with a chargepoint. If that comes into effect then datasets that describe the level of new-build housing development in an area will be key in showing how demand for EV might change over time.

External Push Factors

The final piece of the puzzle here is the external factors that may encourage people to adopt an EV. Local initiatives (often led by Local Government) are key here. Many cities are rolling out schemes such as ultra-low emission zones (ULEZ) that restrict usage of certain types of vehicle and that might prove the push that some people need to adopt an EV. It will be instructive for Automotive planners to keep an eye on which cities will follow the lead of London, Bristol or Birmingham (to name but three) to see where EV demand could spike next. But it would also be wise to see what else is in play. Complementary schemes such as car-sharing, park and ride or cycle-to-work schemes might provide alternatives that might deter the take-up of EV in that area as people feel they can reduce their carbon footprint in other ways.

But with the “stick” to push people away from their current vehicles there also needs to be the “carrot” to help them adopt the alternatives. The Government grants for EV have already been cut once and any further reduction might see a substantial drop-off in the more price-conscious consumer types that might otherwise have considered an EV. Will they instead look for a cheaper used or nearly-new post Europe 6 Diesel or Euro 4 Petrol model (which are exempt in some clean air schemes) or downsize to a model with a lower emission rate? The impacts of these schemes could be felt in other areas of the Automotive industry, rather than just the take-up of EV, so again a geographical consumer-driven perspective is essential.

Understanding EV Demand

We have explored just a few areas in the multi-faceted world of Electric Vehicles. There are still some considerable hurdles to cross in terms of both public perception and infrastructure challenges before they reach the levels of ubiquity that are envisioned by some long-term forecasts. Until that point is reached the take-up of these vehicles will be driven by demand and supply.

At CACI we contend that a consumer-centric approach driven through data products such as Acorn, blended with other complementary datasets provides the means to estimate and quantify where Automotive manufacturers can best achieve success in this field. To find out how we can help you, get in touch.

Two Trains, Two Directions, One Line of Track – It Still Happens

Two Trains, Two Directions, One Line of Track – It Still Happens

It sounds like something from an overblown Hollywood blockbuster, two trains hurtling towards each other on one line of track, but this is a scenario that still, occasionally, plays out in real life. Over dramatic? Perhaps. But the risk in such a situation occurring is obvious and the cost, in human and financial terms, is potentially vast.

On 28 August 2019 this scenario was played out. The Rail Accident Investigation Branch (RAIB) reported an incident at Romney Sands, in Kent, during which two trains were erroneously authorised to use the same single line, despite travelling in opposite directions. The driver of one of the trains realised there was another train coming towards theirs just after leaving Romney Sands station. Their emergency stop message was heard by the other driver via their communication system and the two trains came to a halt 316 metres apart. You can read the full incident report on the RAIB site here.

Effective Systems Reduce Risk

Whilst no one was hurt during the incident, it does highlight the inherent danger in human error. The RAIB notes that the incident shows the importance of, “having systems and processes in place which can provide additional safeguards when safe operations otherwise rely on the actions of people.”

Running on a ticket and tablet system, the single stretch of rail requires a train driver to be in possession of the tablet for that single line of rail. Upon arrival at the next stop, they hand it over to the stationmaster so it can be passed to the next driver. Where two trains are travelling in the same direction on that stretch, the stationmaster can issue a ticket in lieu of the tablet for the train to safely pass.

This incident at Romney Sands occurred because of under-trained staff and confusion brought about by changes to the timetable which perhaps were not communicated as clearly as they could have been. It is strikingly obvious that utilising modern technology solutions would have avoided this incident.

Outdated Methods

So, can train operators afford to continue with such outdated methods, allowing the threat of human error to jeopardise not only the smooth running of their services, but also the lives of their staff and passengers? Nothing serious happened on this occasion, but it’s too close a call to be deemed acceptable.

In its notes, the RAIB offers ‘previous similar occurrences’ to compare an incident to.

Near Abermule, Montgomeryshire (now Powys) on 26 January 1921, there was a head-on collision on a single line between two passenger trains, which resulted in the death of 17 people and serious injuries to 36 others. This disaster occurred because of a chain of errors, misunderstandings and non-compliance with the rules by station staff and train crew. There are clear parallels with the events leading up to the incident at Romney Sands.

More detail on that incident can be found here.

It would seem that some elements of the rail network haven’t made much advancement in the past 98 years, which will be a great concern to passengers using these services. Structuring the scheduling of such services can be done easily – and flexibly – via modern software solutions, which enhance the work of stationmasters and provide a clear overview of which trains are running and where.

MODERN TECHNOLOGY CAN HELP
Deploying technology in the process provides schedulers with a single source of truth and an easy means of communicating schedule changes to drivers and stationmasters. Schedulers would be able to approve a train to use a single section of track, with the backup of technology to highlight potential conflict and the further input of the stationmaster on ground. The incident at Romney Sands arose, in part, out of confusion emanating from a change to the timetable which was affected at late notice in order to minimise the impact on the network of an earlier late running train.

Such instructions can be easily handled with technology but can lead to confusion in wholly manual processes and, in this case, severe danger. The technology is available to transport networks now. There is no need to keep on repeating mistakes from the 1920s.

Technology Can Improve Inspections and Safety in the Rail Industry

Technology Can Improve Inspections and Safety in the Rail Industry

On 1 December 2018 a passenger was hit by the branch of a tree whilst leaning out of the window of a train travelling at 75mph. The accident was fatal and was later investigated by the RAIB (Rail Accident Investigation Branch) which identified a string of errors across two operating companies which contributed in their own small ways to the incident occurring, from inadequate signage and inspections, to systems failing to pick up on outstanding work. So, how can these be avoided going forward?

The train was operated by GWR (Great Western Railway) and the infrastructure by Network Rail. Both companies must carry out regular inspections in order to comply with health and safety regulations. Compliance is an issue raised by this case and the consideration of how transport operators can effectively manage and meet their compliance requirements.

Failed Inspections

The RAIB report noted failings on both sides, with inadequate signage on board the train and inadequate trackside inspections of vegetation.

GWR had been due to install enhanced warning signs on the train in May 2018 to better reflect the danger posed by leaning out of the window whilst the train is moving. The enhancement was never made because two staff members had left the company and GWR’s system for tracking such inspections and alterations had failed.

Network Rail had not conducted a tree inspection in the area of the accident since 2009. An arboricultural report, commissioned by Network Rail after the accident, reported that a competent inspection post-2014 would have identified the decay in the tree, rendering it hazardous to the railway line. The tree had been in its hazardous position for at least 22 months prior to the accident.

Regular vegetation checks are required to reduce the risk of accidents and train derailment. Any tree encroaching on to a railway line that is 150mm in diameter or more is a derailment risk. Network Rail has two methods of conducting inspections: vegetation on foot and cab ride. Both inspections are completed by filling out paperwork and submitting a Track Engineering Form. Work, where necessary, is assigned on the back of this. It is a very manual process.

Staff Training

Furthermore, Network Rail’s staff were undertrained to carry out these inspections and their supervisor didn’t realise that the paper forms were being incorrectly submitted. It is also noted by RAIB that he was unaware of the standards which needed to be conformed to.

So, this incident has highlighted a few shortcomings in the way in which Network Rail and train operators remain compliant with standards and regulations. Inadequate signage, a failure in the system to implement agreed enhancements because staff had left and the work went unchecked, led to GWR’s failings. Inadequate rail side vegetation inspections, underqualified inspectors and supervisors unaware that paperwork was being submitted incorrectly caused the Network Rail failings.

Such manual processes for such important work and inspections are outdated and have been exposed in this case. Whilst none of the failures may be directly responsible for the tragic events which occurred, the event does highlight the need for improvements in the processes.

Using technology is the most efficient way of running such processes – by being able to schedule and track work in a single database. This would allow schedulers and supervisors to easily identify where work has not been completed, where it has been completed by underqualified staff and where remedial work has been suggested as part of an inspection.

Automating Workforce Management

The example here, of enhanced signage alerting passengers of the danger of leaning out of the window of a moving train not being implemented, highlights the importance of effectively monitoring agreed work. This would not have happened in an automated system which can alert management to unfulfilled work.

Similarly, with an automated system, rail side inspections can be scheduled to ensure that they are conducted by qualified staff and submitted correctly. The system would flag any incorrect submissions.

Beyond the safety narrative and the events surrounding this incident, technology can deliver a far more efficient and accurate way of complying with regulations. This would not only help to reduce the likelihood of repeat incidents, but also help train operators to have far greater oversight of their operations via a single source of truth. Technology can ensure that inspectors are only allocated jobs if they have relevant experience or qualifications. Automated workflows can also then ensure where issues are identified, rectification work can be allocated to the right teams and monitored to completion.

The technology to make these changes exists today. Transport operators don’t need to operate using analogue methods in a digital age.

The Wealth of the Nation 2019

Every year CACI release their updated estimates of the income of households across the United Kingdom, with data indicating the average household income for every single one of the 1.7 million residential postcodes in the UK.

With the release of the 2019 data this Spring it provides a great opportunity for us to take stock of the nation’s finances, their disparities and some overarching trends.

Over the next few weeks we’ll highlight some our findings from analysis of the data in a series of blogs under the “Wealth of the Nation” banner, and provide informed opinion pieces on a range of topics including affordability of housing, the behaviour of the nation’s savers and a look at the underbanked, those without access to a full service bank account, and how their needs might be addressed.

These reports are authored by our very own subject matter experts who work directly with many leading organisations and well known brands across finance, local government, property, retail and other sectors.

But we’ll start today with a few headline numbers.

In 2019 the average gross household income in the UK was £39,800, an increase from £39,100 in 2018. Drill down and the differences become apparent. At a Regional level the South East has, not surprisingly, the highest mean figure at £46,400, and Northern Ireland has the lowest at £33,400.

London residents aren’t far behind the south east with a mean gross household income of £44,000.

London residents aren’t far behind the South East with a mean gross household income of £44,000. However, when you look at disposable income, once the cost of mortgage, rents, bills and other essential outgoings are taken into account, Londoners are actually doing worse than the UK average, with a net disposable income of just £13,600 against a UK average of £17,500.

Of course within London itself there is a huge income disparity, with a proportion of households receiving incomes far exceeding the national average.

Drilling further down we’ve identified the top 10 and bottom 10 Postcode Sectors in the UK by Mean Household Income:

Top 10 Postcode Sectors By Mean Annual Household Income:

  • EC3N 4 – London – £73,700
  • WD3 4 – Loudwater – £73,000
  • SE21 7 – London – £72,800
  • SW11 6 – London – £71,200
  • AL5 3 – Harpenden – £71,100
  • AL5 2 – Harpenden – £70,800
  • SW1Y 5 – London – £70,700
  • N20 8 – London – £70,500
  • AL1 4 – St Albans – £69,900
  • KT22 0 – Oxshott – £69,700

Bottom 10 Postcode Sectors by Mean Annual Household Income:

  • TS1 5 – Middlesbrough – £14,800
  • PA15 1 – Greenock – £15,000
  • B7 4 – Birmingham – £15,100
  • CH41 3 – Birkenhead – £15,100
  • B19 3 – Birmingham – £15,600
  • BT13 1 – Belfast – £15,900
  • L28 7 – Liverpool – £16,000
  • L5 0 – Liverpool – £16,100
  • L28 5 – Liverpool – £16,200
  • L20 8 – Bootle – £16,600

Top 10 Local Authorities by Mean Annual Household Income:

  • Elmbridge – £58,300
  • Richmond upon Thames – £58,000
  • St Albans – £57,500
  • Wokingham – £57,200
  • Chiltern – £57,100
  • Epsom and Ewell – £56,100
  • Hart – £55,400
  • Surrey Heath – £55,300
  • South Bucks – £55,200
  • Waverley – £54,900

Bottom 10 Local Authorities by Mean Annual Household Income:

  • Blaenau Gwent – £28,000
  • Knowsley – £28,200
  • Nottingham – £28,600
  • Sandwell – £28,900
  • Strabane – £29,100
  • Stoke-on-Trent – £29,100
  • Liverpool – £29,200
  • Kingston upon Hull – £29,300
  • Belfast – £29,700
  • Merthyr Tydfil – £30,400

By aggregating from individual postcodes we can understand and compare average incomes at any geographical level.

We can also do this across different demographic groups. For example, Manchester has the lowest average income for retired households of all Local Authorities at £17,900, whilst other demographic groups have proportionally higher incomes.

That said, retired households will, in general, have significantly lower outgoings, and the disposable income for retired households is often higher than for single and young couples.
Equivalised income estimates provide a further means of comparison, taking into account household size.

Manchester has the lowest average income for retired households of all local authorities at £17,900, whilst other demographic groups have proportionally higher incomes

All this information has proved vital time and time again for our clients – decision makers and policy makers from all areas of business and government – to provide a detailed understanding of areas, key to supporting the needs of communities, providing appropriate services and to make sound commercial judgements.

All figures quoted in this article are sourced from CACI’s Paycheck and Paycheck Disposable Income datasets.

Do you know your ABC?

Everyone knows that ABC1s are the most affluent consumers in the country. Right?

Honing your audience down to ABC1s means that your targeting is working. Right?

Setting your budget based on the number of ABC1s will ensure that your resources are going to the right place. Right?

Erm….not quite!

For years, every marketer worth their salt would trumpet the accolades of ABC1s. Back in the day (1960’s) they were seen as the pinnacle of wealthy, discerning, trend-setting consumers. These top three rungs of the social grade ladder were largely defined through the status of their occupation and thought to be more educated with better paid jobs.

In the past 50 years we, in the UK, have had a fundamental shift in the way we work as well as the industries in which we work and the roles we’re employed in. Gone are the distinctions between those in the office and those on the shop floor. Skilled manual workers are now as attractive to commercial entities as their bosses.

A huge 60% of UK adults are now classed as ABC1. That’s around 30 million people.

The problem with targeting ABC1s is that it isn’t actually targeting at all. A huge 60% of UK adults are now classed as ABC1. That’s around 30 million people. This might be good for those products and services which are used by almost everybody (e.g. petrol), but if you’re looking to get the most out of your marketing budget and still target the best customers a better approach is necessary.

A New Way

The Office for National Statistics (ONS) recognised this problem and have been creating a classification of small areas since 1971. ONS’s Output Area Classification (OAC) uses census data to classify output areas allowing public sector bodies to get a deeper understanding of local residents at the time of the most recent census. I would encourage anybody who is new to consumer classifications or segmentations to download OAC free of charge to understand the power of such an approach.

Further on from OAC are the highly accurate commercial segmentations. Acorn is ours.

Acorn was the first commercial geo-demographic segmentation in the UK, created way back in 1978. Since then it has been rebuilt with the release of each census. The most recent incarnation has had a major methodological overhaul and does not rely on any census data but uses, amongst others, Open Data sources which are updated much more frequently than the decennial census, resulting in a very up to date, very accurate postcode level segmentation.

1.1 Billion Data Points

Classifications like Acorn allows marketers to hone their audience, refine their message and perfect their channels. Acorn uses 1.1 billion data items to classify each postcode into 1 of 62 types and a further 800+ variables to help describe and understand each one.

So, if you are looking to market your product/service to wealthy families in suburban neighbourhoods, there are a couple of types which match your target resulting in an audience of around 2 million households or around 7.5% of the UK.

From the above mentioned 800+ variables that help us understand them, we can infer that these customers:

  • Tend to shop for premium goods rather than standard
  • Shop online, not for bargains, but for the convenience
  • Are more likely to respond to direct marketing where they are referred to by name
  • No more likely than average to use social media
  • Use the internet daily:
    • Sites regularly visited include; John Lewis, M&S, Selfridges, Net-a-Porter
    • Regular users of services such as banking, insurance
    • Booking tickets (airline, events, travel and holidays)

At the other end of the spectrum, a local authority may be looking to increase recycling rates. The 800+ variables now helps to decide which neighbourhoods should be targeted and more importantly which should not.

Simple analysis shows that young, educated people in urban neighbourhoods tend not to need to be told to recycle so targeting them with environment messages regardless of channel is a waste.

The make up of ABC1s makes them a very difficult audience to market to. Imagine trying to create an eye-catching message that engages and resonates perfectly with all 30 million people. On top of this you’ll also need to try and choose the right channel that will deliver this message at the right time! This is what targeting ABC1s is fundamentally trying to do. By ‘targeting’ such a large proportion of the population, marketing messages (and marketing dollars) are diluted to a point that they don’t target anyone.

So you may know your ABC, but do you know your ABC1s? In the 21st century its time to learn a new alphabet – A.C.O.R.N.

The Demographics of Building Homes: Who’s Likely to Move In?

As residential building becomes increasingly competitive, developers need to take a more strategic approach to how, what and where they choose to build – and who they build for.

We’ve previously looked at how data from our Ocean database, combined with the Institution for Social and Economic Research’s Understanding Society study, helped us to identify ‘likely movers’ – those with the highest propensity to move within a year – and where they currently live in the UK.

This data doesn’t just offer information about the location of potential movers – we’ve also been able to dig deeper into the demographics that make up the 8.6 million people most likely to move in the next 12 months.

Segmenting The Likely Movers

For developers, understanding the potential customer is key to shaping the offering they build. We used Acorn, our demographic classification tool, to build more detailed profiles of the different target markets.

Acorn segments the UK’s households, neighbourhoods and postcodes into six broad categories and 18 specific types, defined by basic characteristics such as age and income, and more in-depth factors, like lifestyle. By sorting our information about likely movers into Acorn groups, we’ve identified the top five groups that have the highest potential to move in the next year:

  1. Student Life
  2. City Sophisticates
  3. Young Hardship
  4. Career Climbers
  5. Starting out

The ‘Student Life’ group, which is part of the ‘Financially Stretched’ Acorn category, are five times more likely to move than the UK average. This is largely to do with their life stage, as they often live in shared, purpose-built student housing or short-term private rental arrangements while studying. Many will move multiple times during their student years – and will often move into their first non-family home when they graduate, which is an obvious opportunity for developers.

Using these Acorn classifications, house builders can answer a vital question: “who do we want to buy our properties?” By identifying their ideal market – whether that’s students, people moving into cities for work, young families just getting started, or elderly people moving into retirement homes – residential developers tailor both their builds and their marketing campaigns to deliver a faster return on investment.

Finding Tomorrow’s Customers

However, simply knowing who you want to target won’t be enough. Developers also need to consider when they will be targeting their chosen group.

No person stays in one Acorn group throughout their entire life. And that means their needs and interests will change as they move from one category to another. Say the development will be a purpose-built private rental scheme aimed at Career Climbers – if the build takes 18 months, by the time it’s completed many of the Career Climber group will have progressed into another category, such as City Sophisticate.

That means developers need to anticipate their future market – the renters of tomorrow, who will be building their careers and becoming potential customers. Using Acorn data, we can help developers plot ‘lifecycles’ for their target markets, helping them identify which sections of the population are likely to be in their target market when a development is finished.

This gives new developments a key advantage: rather than finishing a build, then advertising to the target market, developers can reach their potential customers before they’re even ready to move.

Understanding Potential Buyers

Finding your audience ahead of time is undoubtedly the key to unlocking the fastest possible return on investment from your next development. Our unique population data and analysis also lets us dig into where likely movers live now, how their income affects how much they can afford to spend, and the amenities they look for in their next home.

If you want to hear more about how CACI’s Property expertise can help you, get in contact now.

Effective Deployment of Your Field Sales Reps: Your Route Optimisation Options

Effective Deployment of Your Field Sales Reps: Your Route Optimisation Options

The amount of time your sales reps spend behind the wheel has a direct impact on their call rates and fundamentally, their ability to generate sales.

34% – the average amount of time a sales rep spends behind the wheel

Route optimisation is how you can get your sales reps to reach their full potential. The benefits of this are well documented, but implementing that change using technology has pitfalls. I’ve spent most of my professional career helping people like you weigh up the options when it comes to route planning tools, and guiding them around those pitfalls. There are several options when it comes to route optimisation. The word “Dynamic” is increasingly used, but few people seem to agree what that means, and what it looks like in the hands of a sales rep. This breeds confusion and hinders decision making:

In my experience, you have three options:

  1. Static: Optimise the sales reps route for them
  2. Agile: Help your sales reps optimise their route
  3. Dynamic: Let your sales reps optimise their own route

The differentiator between these three is the amount of help you give the reps, the form that help takes, and ultimately where the responsibility of optimisation sits.

Static – Do It for Them

You decide on a preconceived contact strategy which dictates the visits that are to be scheduled, and a timescale over which they need to be accomplished (typically 1-12 weeks). By using a piece of software with an integrated algorithm you can build an efficient schedule. That algorithm builds in travel time, as well as other factors such as customers needing more than one visit, and customer availability. That schedule is then deployed to the field. This can lead to efficiencies across the board.

We call this Static because changes to the route are not made by the software, and the routes in each call cycle tend to look a lot like the last. Instead, the reps are empowered to manage that schedule with guidelines on what adjustments they can make to their own diary should change be needed. At the end of the call cycle the process is repeated with the schedule adjusted to take into account new and lost customers. I have seen a small slow-down in the number of companies opting for this, it is still by far the most commonly implemented technology based solution.

Agile – Help Them Do It

There is huge potential for including measures of customer value into route optimisation. Doing so will help an organisation get an even better return on investment from their field sales team by visiting the right customers at the right time. I recall a customer of CACI’s, Yakult, doing this 12 years ago, and building routes on a weekly basis to only those customers whom EPOS data identified as being most in need of a visit. At the time they were unique in this approach, but it proved very successful.

CACI helped us drive out inefficiencies, improve utilisation and reduce costs. We also have a happier, more productive field sales force driving huge benefits to our bottom line

This approach assumes a degree of flexibility in the selection of the customers you decide to visit and a reps schedule can change drastically from one call cycle to the next. The reality is, not all customers are equally important every call cycle. I noticed agile re-emerge as a mainstream approach to route optimisation about 3 years ago, and today data-driven route planning is gaining a lot of traction. An Agile approach introduces value to the route optimisation process, it questions the value of calling on each customer and summarise that value as a single priority score. That priority score determines whether it will be routed in the call cycle or not.

Software is used to build an efficient schedule, but now the priority score lets the algorithm recognise the most important customers to schedule and factor their relative value into the decision-making process. That schedule tends to be shorter than Static planning, typically 1-4 weeks, due to the data refresh cycle of your priority score.

Dynamic – Let Them Do It

The fall-back approach to route planning is to let reps do it themselves. This can be the least efficient method as we know that those routes have 20% more driving than those created by an algorithm **. But a new Dynamic approach combines the knowledge of the sales rep and the power of an algorithm to produce more effective and optimised routes.

Workforce management apps have brought a new dimension to managing field sales people, enabling you to communicate easily with your reps, and allowing them to capture data and report back to you over the course of their day. With technology firmly in their hands many options are emerging to return to reps planning their own routes, but with an algorithm at their fingertips.

Dynamic can be great if your people often have their day disrupted by external factors such as visits over running, or finding that the decision-maker is not available when they arrive. It allows them to re-optimise their own diary on the move.

Summary

In my experience static is still the most common, with a shift towards agile. CACI have been helping organisations schedule efficient routes whatever their preferred method. CACI have been delivering both since they came into being, and we are pleased to be releasing the latest version of our route optimisation software, CallSmart, via the cloud so that you can optimise routes faster than ever before.

Dynamic comes with some question marks because it is something that is still being refined by technology companies. Our approach to dynamic has been to make CallSmart’s optimisation algorithm available via your own workforce management app giving you the flexibility to employ it as you see fit.

Optimising Headcount For Increased Field Sales Team Performance New

Optimising Headcount For Increased Field Sales Team Performance New

Field sales teams that are the right size and fully utilised are often high-performing. Striking this delicate balance is critical to gaining efficiency in the field, which will result in lower costs and higher sales.

When managing a field sales team – regardless of size – your ultimate goal is to maintain customer service levels and maximise sales opportunities.

There’s a lot of work for your people to do as individuals to achieve that, but you also play a vital role in optimising workloads and giving every field sales person the opportunity to excel.

Many field sales people will be spending a significant amount of time driving, when they could otherwise be selling. When planning, if you get the driving time wrong your headcount will be wrong – it’s an important balance to strike.

Here are three tips to help you better analyse and utilise headcount.

1. Grow your Process, Not Your Workforce

A field sales team is a naturally expensive resource. When you factor in salaries, vehicles, fuel and expenses, bonuses, training, and equipment like laptops and phones, the costs soon mount up. Get the headcount wrong, and it could be costing your company thousands.

But without the right technology in place to combine millions of drive time calculations, it’s impossible to produce something accurate, or indeed discover how you can improve when, where, and how often your field sales people visit customers and prospects.

Optimisation doesn’t necessarily mean operating at 100%. More likely, you’ll want to use 90-95% of a field sales person’s day. That way you can reduce headcount and maintain call coverage, or increase call coverage with your existing team.

Without the right technology in place to combine millions of drive time calculations, it’s impossible to produce something accurate

2. Invest in Efficiency to Maximise ROI

Field sales people do two things: they drive and make calls. Given that driving can account for as much as 34% of a field sales person’s day, it’s critical to know how much driving a field sales team should be doing to be efficient.

Underestimate drive time, and you won’t be able to achieve the call coverage, which means customer service levels will be lower, and you’ll be missing out on valuable sales. Likewise, too many heads will be an unnecessary drain on costs.

The reality is that driving time is different for every call depending on the road network and customer density, so it’s vitally important to get it right first time.

Driving can account for as much as 34% of a field sales person’s day

3. Make Sure You Have the Right Software to Support your Team

Most planners have probably conducted a headcount analysis and factored in call locations, call times and frequencies, call cycles, and working hours of their staff. They may have even attempted to incorporate driving time as well – but this will have been a rudimentary estimate, and ultimately incorrect.

By eliminating human error and uncertainty, field sales teams can extract vast amounts of insight – and new revenue – simply by implementing intelligent software into their process.

Before organisations engage with CACI, we often find that their field-based sales teams are working at around 80% capacity (with some people within the team working at over 100%, or under 60%).

The right software can help you achieve the utilisation that is right for your business and give you the confidence that you can hit your coverage targets.

Headcount Analysis: Sell More, Save Money

Before you can make a big decision like increasing headcount, you need the full facts backed by hard, reliable data. Without it, you’re merely going off your best judgement and guess-work.

The majority of companies we come across have around 10% more headcount than is necessary.

If you want to hear more about how CACI’s Field Force expertise can help you, get in contact now.

Optimised Call Scheduling: Giving Field Sales People the Freedom To Sell

Optimised Call Scheduling: Giving Field Sales People the Freedom To Sell

Your field sales people are exactly that – sales people. So why are they unnecessarily organising their own call schedules? It’s time for them to focus on what they do best – and technology holds the answer.

Think about how valuable field sales reps are to your organisation. Certainly, the best talent can bear significant fruit, and the more customers you put them in front of, the more sales you’re going to make.

So, when your field sales reps’ time is so valuable, why would you have them spend precious time planning their own call schedules, when they could be selling?

Manual route planning by field sales reps is far from efficient, and ultimately results in:

  • More time spent routing than selling
  • Higher mileage bills and carbon emissions
  • Disconnects between corporate and personal goals
  • Missed call and revenue opportunities

Experienced Reps Versus An Algorithm

There’s no doubt that field sales teams are extremely expensive to run. To make a positive return on this investment, you need to ensure your reps are driving less, and crucially, selling more. And it’s important to recognise that the skills that make great field sales people don’t necessarily make expert call schedulers and route planners. It simply shouldn’t be part of their job role.

Consider the number of variables: visits and drivetimes, worktime legislation, overnight stops, visit restrictions, decision maker availability, other events, the rurality of certain areas – the list can be endless.

The level of information required to make a quick and accurate set of route calculations is far beyond any human (more than 3.6 million for a day consisting of only ten calls).

The Right Software Can Reduce Time Spent Driving By Up to 20%

So, no matter how experienced the field sales person, they will never be able to achieve an optimal sequence of calls on their own, and their priority should always be selling.

A solution such as CACI’s CallSmart has the ability to optimise your team’s daily routes for each territory, and help your field sales reps reduce their mileage and maximise their calls – without taxing their valuable time.

Not only can the right software reduce time spent driving by up to 20%, automatically optimising routes for the whole team across the call cycle, means your company will spend up to 70% less time planning.

Less Driving, Fewer Emissions

Businesses are increasingly challenged to be more efficient in terms of their environmental impact. And the bigger the company, the greater the pressure. Indeed, most annual reports now devote entire sections to sustainability, and many have signed up to climate change goals.

By reducing driving time you’ll save money and also reduce carbon emissions.

But for most field sales teams, driving is an unavoidable activity, and often the only sensible way to travel around the country quickly.

So by reducing driving time, you’ll not only save money, but you’ll also reduce carbon emissions.

The Field Sales Team Planning Solution

While some field sales reps will be confident that they know the best way to schedule their calls, the fact is, it’s an impossibility. Automated software solutions are proven to yield far greater efficiency and greater revenues.

Aside from the fact that it’s impossible to factor in millions of calculations into planning decisions without software, the expense of running a field sales team, combined with inefficient call schedules affecting bottom lines, the case for automated call scheduling has never been greater.

CACI’s CallSmart software removes the guesswork by automatically identifying the most efficient call sequence for field sales reps. Many organisations are already seeing the benefits of CallSmart with 20% average reduction in drive time and fewer miles travelled.

Territory Optimisation: Levelling the Field Sales Playing Field With Technology

Territory Optimisation: Levelling the Field Sales Playing Field With Technology

Territory optimisation is all about field sales reps being in the right place, with the ability to deliver more calls with less driving. But to create a drive time efficient, balanced, territory structure, planners must look beyond manual methods and simple postcode allocations for the answer…

In a perfect world, each of your field sales reps would be working exactly the same hours, consistently hitting their targets and doing so with minimal driving.

In reality, there’s no field sales team in the world that can manage this level of perfection, or indeed balance everything they need to do on their own.

Manual methods are highly subjective, time consuming, and often create significant Inefficiencies. For example, a manually created territory structure (with no drive time factored in), will probably have:

  1. Reps living in the wrong locations
  2. Unnecessary driving time
  3. Imbalanced territories

The average sales territory imbalance stands at around 18%

With drive time efficient, workload balanced territories; your field sales team’s overall call coverage greatly increases. This means less time driving, and more time with clients to hit your KPIs and develop new business opportunities.

Workload Imbalance

The reality is that driving is unproductive, expensive, and results in fewer calls being made than could otherwise be achieved. It is also a contributing factor to why the average sales territory imbalance stands at around 18%.

To put that into perspective, overworked territories could be trying to squeeze in as much as six days work into a five-day week. Compare that to team members who are underworked and only working four out of five days in reality and plugging the gaps with low value visits, and you’ve got a potential recipe for disaster.

The only effective way to redress this imbalance is by using applications that can make precise calculations based on captured information such as where field sales reps live, the road network, call locations, visit frequencies and visit durations.

It’s a level of accuracy which simply can’t be achieved with manual methods.

With the right software and data at your fingertips, you can automatically create territories that are workload balanced and drive time compact.

Missed Sales Opportunities

Territory imbalance also has a very real effect on the bottom line.

Imbalanced territories can lead to many customers (both current and potential) being overlooked by reps who are overstretched. Likewise, if a territory is underworked, field sales reps that could be making more calls and selling more, simply aren’t doing so.

Fixing an Imbalanced Territory Structure Can Increase Call Coverage By 3%

Effect on Team Members

It’s not only revenues which are affected by imbalanced territories and too much driving. Unnecessary pressure on field sales reps and unachievable targets in the time they have can create a perfect storm of dissatisfaction, feelings of unappreciation, and long commutes which create a poor work-life balance.

This can result in high staff turnover, valuable knowledge and skills being lost, and underserved customers. The cost of your field sales team is already high, so whatever you can do to limit staff turnover will help your bottom line.

Optimised Territories Demand Sophisticated Software

Territory division in field sales is quite literally a balancing act, and requires sophisticated algorithms to manage the complex combination of geography, customer locations, and rep locations.

The penalties for getting it wrong are not only negative impacts on the bottom line but also client relationships.

CACI’s InSite FieldForce software can help you achieve a better balance. You can not only achieve a balanced and efficient territory, but you can also significantly reduce drive time, increase staff retention, and grow revenues.

Like many other organisations, your territories could be 18% imbalanced. Get in touch with us to find out if you could increase your call coverage by 3% and do more with less.

If you want to hear more about how CACI’s Field Force expertise can help you, get in contact now.