The growth of online: a surprising pivot in 2023

The growth of online: a surprising pivot in 2023

Over the last three years, we have seen a more significant shift in consumer habits than we could have imagined. Currently challenged by the rising cost of living and an economy in recession, the post-pandemic spending bubble was cut much shorter than initially anticipated by economists.

Like everyone in January, CACI reflected on the last few years, and as part of this, we revisited predictions that we made during the height of the Covid-19 pandemic. Consumer behaviour changed significantly in the space of several days, triggered by widespread temporary store closures during the lockdowns. Some stores were never able to reopen; whilst online platforms boomed, in light of these significant behavioural shifts, CACI rebuilt predictions to reflect this new normal.

How close were CACI’s consumer online spending predictions to actual results?

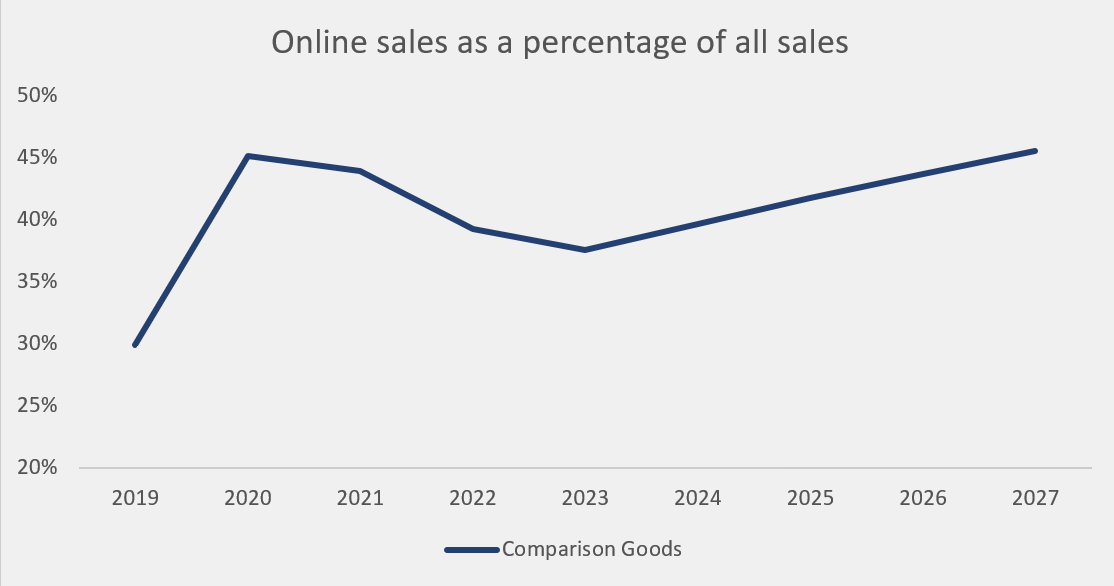
Mirroring our spend predictions, a phrase we maintained at CACI at the time was that “online spend jumped forwards five years in one month”. What we have come to realise was that three years on, these spend predictions, shown in the below chart, highlighting a return to in-store, were very close to the true picture.
How can CACI track consumer online spend behaviour?

CACI can unpick these new trends in spend behaviour using our new and exciting tool kit of Spend Dimensions and Brand Dimensions, which tracks over 200 shopping centres and 300 brands across the UK.

What we can see demonstrated in the above chart is a post-pandemic slump in online spend as a proportion of total spend. In 2023, online spend falls to 38%, before gradually rising again in the preceding years.

Whilst the current split in online and offline engagement provides us with an overall national average, it is important not to expect all shoppers to follow suit. We have seen asset type, product category, brand, region and demographics all play a big part in the extent to which a shopper might engage online.

Who is most likely to shop online?

Demographically, the split between those engaging in-store and online has become less distinct, highlighting the closing of the digital gap between young and old, with the difference between online market share across all groups dropping from 10% to 5% over the last year.

However, the big picture doesn’t change. Key online shoppers continue to be younger shoppers across the affluence spectrum as well as more affluent shoppers, likely driven by greater access to e-commerce platforms and the ability to afford delivery costs.

How does this vary by product category?

The recent shift back towards in-store engagement isn’t clear-cut and does vary by product category. CACI expectations were that the drivers of the overall return to the store would be clothing and footwear, household and health & wellness brands. This has been the general spend trend that we’ve been seeing across the UK since 2020.
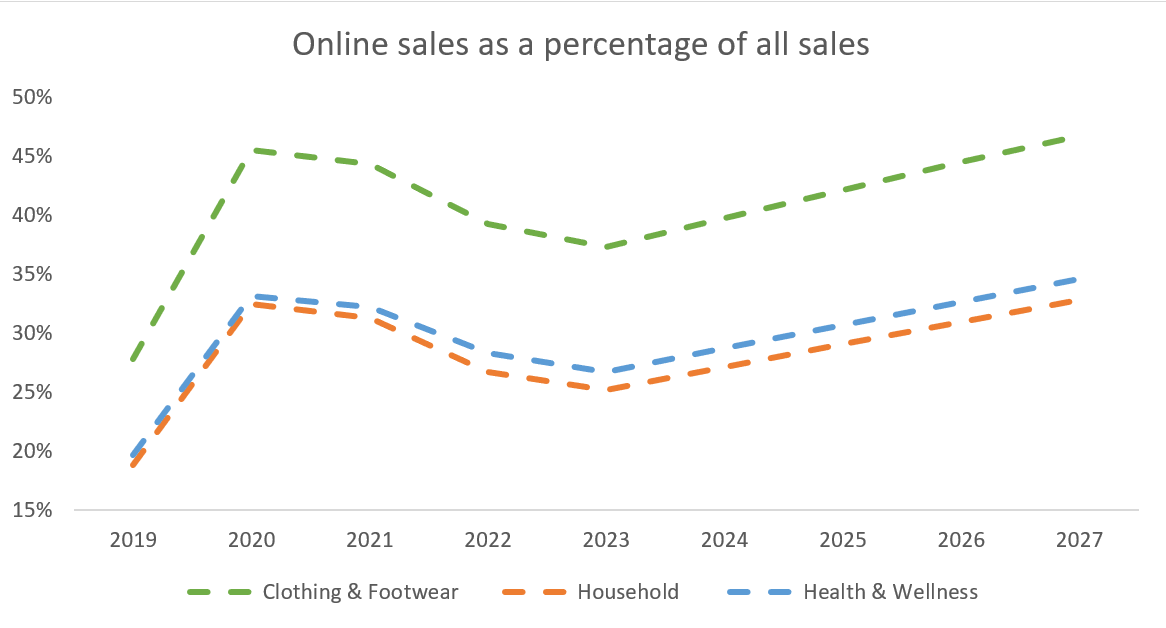
The variation by category gets further exacerbated by the time of year. For example, comparing the months of October to December 2021 and 2022 in the chart below, there was a clear shift for household and kids’ goods spend to in-store, likely driven by the desire to experience before purchasing. Whereas, General Retail painted an interesting picture within the final quarter of 2022. Both in 2020 and 2021, with Black Friday and Cyber Monday taking place in November, Christmas hit online earlier than in-store, boosting online’s share of the market temporarily. In December, our Christmas survey reiterated this sentiment, with over half of those shopping online citing a main drive of this being concern with the rising cost of living and saving money, whereas over half of those shopping in-store did so for the experience. The experience-focused, in-store shoppers drove the resurgence year-on-year of in-store spend in December.

What does the return to in-store mean for retailers?

Across the 300 brands we tracked, many pure online brands are experiencing a decline in market share, in-store brands have typically performed well, and those blended brands have seen a shift towards a greater in-store market share. The power of the store can be seen through brands such as Decathlon, Nespresso, Build-A-Bear and Denby, who have all shifted to greater reliance on the store over the last quarter. In comparison, online disrupter brands such as Vinted and Shein which thrived through the year began to see a drop off.

What does the future of consumer online spending behaviours look like?

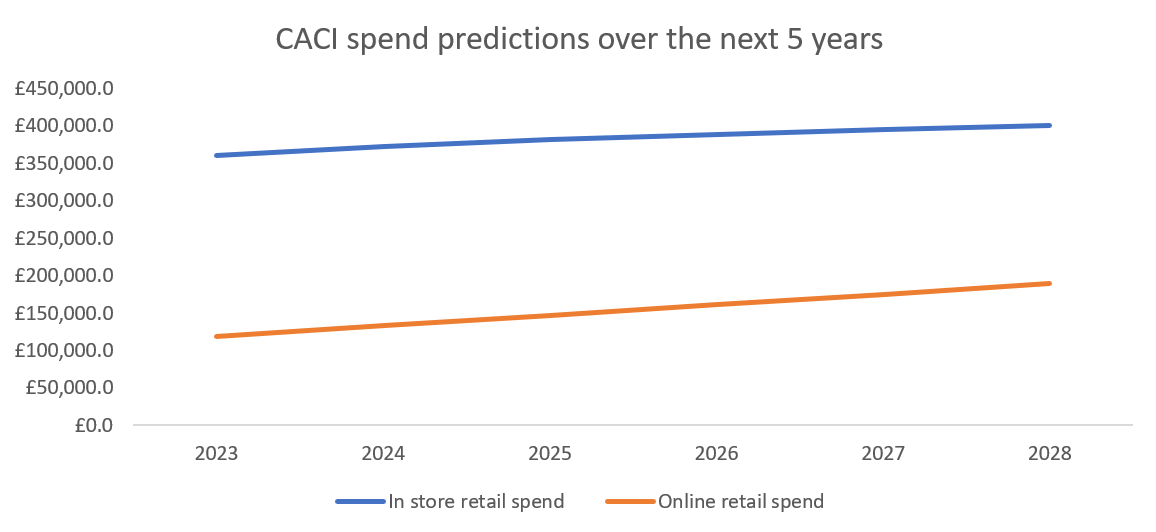
Whilst 2022 did represent a return to bricks and mortar, we are still at least a year ahead of where we would have been if the pandemic hadn’t happened. We expect to see continued growth in both on and offline retail spend, although proportionally online spend will increase.
 

However, it is undoubtedly true that we are currently, and will continue to, experience unexpected macroeconomic challenges which will impact different brands and destinations in different ways. Brands can no longer rely on their name as we have seen with the casualties of too many well-known landlords and retailers. Therefore, making informed decisions through the use of CACI data will help retain a competitive advantage and stand out from the market.

To learn more about how CACI can help your brand navigate changing consumer spending habits, get in touch with us here.
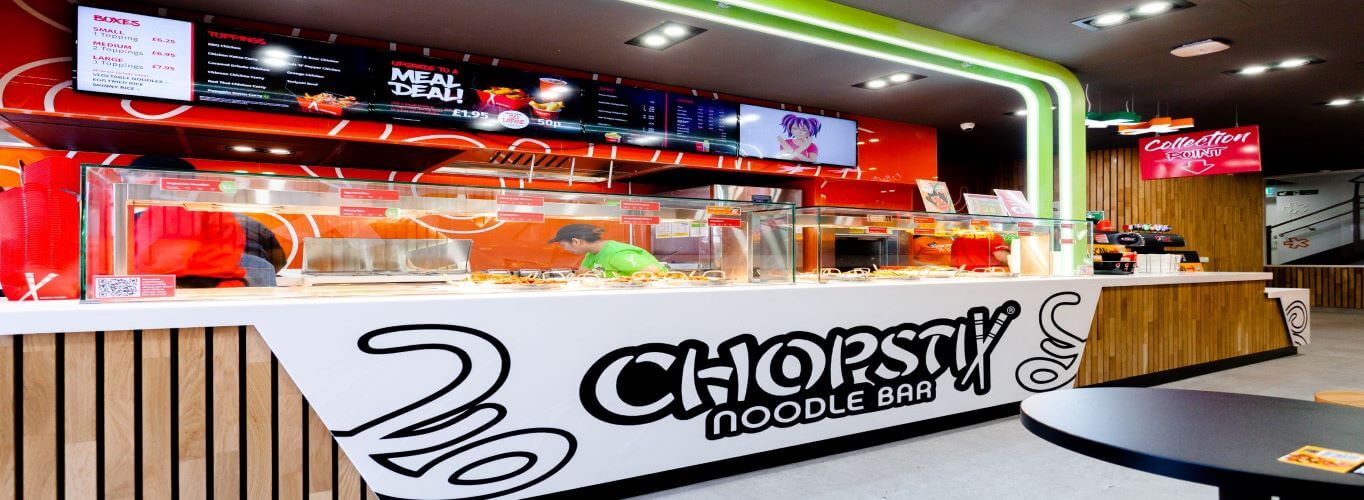
A data-driven approach to successful franchise and equity growth for a Quick Service Restaurant business

A data-driven approach to successful franchise and equity growth for a Quick Service Restaurant business

Highlights

• Evidence-based opportunity mapping
• Regional, local and site performance modelling
• Bespoke dashboard and data model
• Blended geodemographic and sector-specific datasets
• Strategic data partnership for sustainable, accelerated franchise growth

About Chopstix

Chopstix has been boxing noodles on high streets, in shopping centres and in motorway service stations for over 20 years. With nearly 100 outlets and big plans for growth, Chopstix aims to be the UK’s No. 1 Asian inspired quick serve noodle bar. The brand’s mission is to excite customers with great service, great stores and most importantly, great food.

The Challenge

Define and prioritise national, regional and local opportunities for new outlets

Chopstix has an ambitious plan to grow through equity store development and franchising.

 Sumit explains

We wanted a location strategy partner, because of our franchise expansion goals. We needed to understand where the best opportunities lie in the UK, so we can attract successful franchisees.

Sumit Devi, Franchise Manager

The Solution

A bespoke data dashboard using a wide range of performance factors

CACI built a dashboard model using a range of variables based on CACI geodemographic data to explain Chopstix outlets’ relative performance and sales potential. The model uses environmental and market factors drawn from CACI’s Acorn, Leisure Footprint (CACI’s bespoke leisure catchment model), Local Footprint model and competitor location datasets, along with Chopstix’ internal financial data.

Sumit explains

We use the PowerBI dashboard as soon as we start engaging franchisees about specific regions. We can show them the opportunity at national, regional and trade zone level on maps. Within each area, we rank potential shopping centre and high street locations by expected turnover and growth, so franchisees can see where to focus and prioritise their launches to support accelerated growth and ROI.

Sumit Devi, Franchise Manager

The Benefits

Sustainable growth through investment and franchising

Aaron explains “Our growth model dashboard is a differentiator in our franchising market. It gives us a common understanding with franchisees of the available opportunity. Trust and transparency are key. We don’t have to spend time arguing about targets – instead, we work together using reliable catchment and market information to make plans with lower risk and higher rewards for everyone. Franchisees can push forward with growth, with confidence, and we increase our UK market share more quickly.

Aaron concludes:

It’s a win-win.

Aaron Moore-Saxton, Franchise Director

Find out more

Please view the full customer story here. If you want to learn more or have any questions please get in touch with us.


Delivering data & insights to provide Bright Horizons with a new approach to childcare

Delivering data & insights to provide Bright Horizons with a new approach to childcare

Highlights

• Bespoke data dashboard and InSite tools
• Acorn geodemographic data for multiple propositions and locations
• Customer and employee profiling to assess community need
• Enabling demand-led growth for genuine customer value
• Rapid report generation to inform many stakeholders

About Bright Horizons

Trusted by families to look after their children for over 30 years, Bright Horizons is an award-winning nursery provider. The company operates over 300 community and workplace nurseries throughout the UK: each is individually designed to serve the needs of its community. Bright Horizons provides tailored childcare for corporate clients and for families, at home, at work and in local settings.

The Challenge

Bright Horizons initially approached CACI for data to support their new site opening and acquisition insight programme. Property Asset Manager Oliver Brookes needed reliable data that was quick and easy to interpret for new site and location decision-making.

Marketing Manager Eddie Thorogood saw a further opportunity to use demographic data to support Bright Horizons’ proposition development and to better understand existing as well as potential catchments.

The Solution

CACI provided Acorn demographics, profiling and mapping, giving insight into specific postcodes and communities. High level demographic maps are instantly visible in InSite’s Locator tool.
Eddie explains: “The blend of data creates reliable and up-to-date information about the demand for our services, to support decision-making about how and where we can expand our operations so we can deliver high quality childcare where it’s needed. It also helps us improve our business model, so we can manage our portfolio and flex and balance our sites to meet changing needs.”

The Benefits

Bright Horizons’ three pillars are ‘people, quality, growth’. Eddie emphasises, “We’re not about just growing for the sake of it. We always want to be where we are needed – where parents can find us and our services will be useful. With this data insight at local level, we can provide a clear picture of community and workplace need to our senior leadership team, so they can sign off new facilities.”

Eddie explains

We have a complex business where everything is audience-centric, so we have multiple offerings. It’s a deeply human business – it’s all about nurturing young children.
The CACI data and dashboard reporting gives us tools to look through every single lens, to understand all the factors that matter to people.

Eddie Thorogood, Marketing Manager, Bright Horizons

Find out more

Please view the full customer story here. If you want to learn more or have any questions please get in touch with us.

The impact of Covid on customer behaviour and nursery growth strategies

The impact of Covid on customer behaviour and nursery growth strategies

As the country learns to live with Covid, CACI’s data and consumer research is revealing what the new normal looks like for the nursery market.

Customer Movement is on the Rise

Let’s start with the positives.  Remember just how much more freedom we have than we did this time last year.  The contrast between the two maps based on anonymised Mobile App data are stark.  The map on the left shows movement activity levels in the last week of March 2021 relative to pre-Covid (Early March 2020) for Central London.

Source: CACI / Digital Envoy

Dark blue shading shows areas that movement levels were way down on pre-pandemic across much of London – not surprising given that restrictions were really only lifted in early April 2021 for all but essential activities (albeit including trips to nurseries).  The map on the right is the same week this year, and shows swathes of red across much of London, highlighting that activity and visits to many of these areas has returned to almost pre-Covid levels as we learn to live with life after Covid.

Despite the fact that we are seeing record numbers testing positive for the new variant there is no doubt that many are back out and getting on with their lives after a painful couple of years.


New Behaviours and Attitudes

But we have emerged into a different world.  The right-hand map shows that the recovery in movement is not universal.   There are still clear areas of blue and lighter red in office dominated parts of the city, and around the major stations of London.  The same pattern is seen in cities across our county.

Analysis of the data reveals that our city centres are only now returning to something close to what we would have called normal before the pandemic, and transport hubs are seeing visits about 25% down.  But regional towns have grown in popularity, with visits up by about 40%.  So, clearly we have changed our activities, and it looks like many of these behaviours are set to remain.

Our towns and cities are changing, and we can see it happening around us.  But it’s a complex picture.  Whilst some have speculated that we are going to witness a long-term boom in the suburbs as everyone moves out of our towns and cities – this is not the case.  Despite the jolt that Covid brought there are too many interactions at play for all the old links to be broken.

CACI’s research, carried out as restrictions were eased, revealed that many 18 to 34 year olds, many in the target age groups for nurseries, were keen to return to our towns and cities.  These included people from across the demographic spectrum with groups with very different lifestyles – from ‘City Sophisticates’ to ‘Struggling Estates’ in CACI’s Acorn classification amongst those most keen to return to urban living.

Consumers are listing eating out, entertainment and leisure activities as the top reasons for wanting to return.

In short, for many our towns and cities remain places of fun, choice and opportunity – and this hasn’t changed with the pandemic.  What we are seeing is that towns and cities are responding to this need.  At CACI we have never been so busy in supporting our leisure clients who are busy trying to extend their portfolios, filling the units vacated by retailers hit by the step change in online shopping triggered by the pandemic.  And other urban offices and former retail units are being repurposed as urban living – a clear sign that everyone is not heading for the countryside and suburbs.

For many, working patterns look like they have changed for the long-term.  Evidenced in the conversion of office space to other purposes and in the areas of blue on the map of central London in worker dominated areas.  Our research revealed that workers claim that 2 to 3 days is the optimum number of days they would like to spend in the office, and this seems to be becoming the norm for many.   But, it is important to remember that not everyone has this option, including most workers in the nursery sector.  It is very easy to think everyone can work from home easily, but affluence, age, location and job role all clearly play a part.

Source: CACI / Digital Envoy

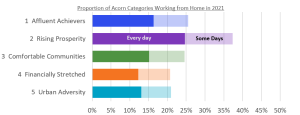
Analysing Kantar’s TGI survey data from 2021 shows that, even in a year scattered with various work from home advice, only 25% of those surveyed said that they worked from home every day, or some days, as their ‘normal’ behaviour.

The chart, using CACI’s broad Acorn Categories to dissect responses, clearly illustrates that it is the ‘Rising Prosperity’ that are most likely to be working from home.   These are younger, well educated professionals moving up the career ladder and living in our major towns and cities.  38% of this segment claim to work from home at least some days, and 25% of this is made up of those working from home every day.  In contrast only 20 or 21% of lower paid, lower qualified segments ‘Financially Stretched’ and ‘Urban Adversity’ have the luxury of even working from home some days.

Source: CACI / Kantar

As a result of this shift workplace nurseries will no doubt continue to suffer, as many will prefer the flexibility of nurseries closer to home, in line with the shift to ‘hybrid’ working, with many neighbourhood nurseries benefiting from this change.  The number of parents requiring nursery spaces is unlikely to be impacted by the rise in home working, as many learnt during the Covid lockdowns that working from home and providing childcare don’t mix.  However, many nurseries are likely to see increasing staffing and pricing complexity with parents expecting a level of flexibility that reflects the new-found flexibility in their working hours and location.

So, despite big changes there is no evidence to suggest a need for wholesale changes in where acquisitive nursery groups should be focussing their attentionThe big urban to rural shift is not happening and indeed CACI’s research shows that even at the peak of the pandemic 10% of house moves were from villages to towns and cities.  Tracking planning applications reveals huge amounts of new dwellings under construction or being proposed in our urban areas and, whilst much of this will have been planned before the pandemic, it’s not that easy to turn a tanker.  It is simply not possible for such a shift to happen without fundamental changes in planning policy and housing stock.

So, in summary whilst the change in residential patterns are moderate it is the behaviours of those residents that have changed, and the following are just a few more key behaviour changes that CACI expect to remain:

  • Communities are eager to stay local
    • This is good news for nurseries operating well-run community nurseries. But it is increasingly important for nurseries to engage with their wider communities and larger groups need to take care not to look like corporate outsiders
  • Social governance is increasingly in the spotlight
    • With consumers expecting their suppliers to behave ethically and transparently
  • Minimising waste and environmental impact is mainstream
    • All nurseries now need to ensure that they are meeting parents’ expectations here and that they are living out the values of care for the environment that the children will inherit
  • Digital is critical to recruitment and engagement
    • There is no doubt that digital is here to stay – so if you are not happy with your website you can be sure that it is putting off potential customers and if you are not sharing key messages with your parents via emails and portals then you may get left behind

New Challenges and Opportunities

Unfortunately, with inflation and rising rocketing fuel prices, there is no doubt that many families are going to be facing increasingly tough decisions about where to prioritise their spending in the year ahead.  This could impact customers’ ability to afford childcare, especially if their salaries rise above the eligibility threshold for free places, but their true disposable incomes fall.

Rising fuel costs for nurseries will compound the challenges of rising wages already driven by the shortfall in staffing that so many in the sector are facing and these need to be factored into nurseries strategic plans.

Successful nurseries should take note of these consumer and market changes, play to their strengths in these areas and they will thrive.  But ignore them at their peril as the sector faces the two emerging, and partly inter-related challenges of staffing and the cost-of-living crisis.

How CACI’s route optimisation software helped Prides Corner Farms

How CACI’s route optimisation software helped Prides Corner Farms

The Challenge

Prides Corner knew they needed software to optimise their truck delivery routes as their business grew. With a team of six working on route planning and sales reps spending many hours a day looking at delivery schedules, the team wanted to reduce workload and automate as much as possible.

“The planning job is complicated, and can be highly challenging,” says IT manager Christian Joseph. “We had been feeling for some time that we needed an automated system to improve our efficiency.” Prides Corner uses a mix of its own and third party drivers and vehicles at its dispatch base in Connecticut.

Sales Manager Ray DeFeo explains: “We generally make smaller deliveries to many places and we need to meet the challenge of fresh stock that has to arrive on time. Dispatching orders the same week is our aim, and quick turnarounds – typically 48-72 hours – are an important point of difference for our customers. There’s lots of change in order patterns day to day and season to season. For instance, in spring we have more large orders, so there are fewer stops per truck. But later in the year a truck may make five to six stops in a journey.”

The team needed a tool that could give them full route visibility, reduce mileage, optimise vehicle numbers and create efficient, cost-effective routes. Prides Corner saw CACI’s route optimisation solutions demonstrated at a trade show and saw its potential immediately.

The Solution

Rolling out  CACI’s software helped Prides Corner take the next step in their programme to improve efficiency and service, building on a successful lean flow shipping operation that uses carts to load trucks. CACI provided the route optimisation software, consultancy, data customisation and implementation support.

Ray DeFeo says, “We did a two-month pilot – I think we were a challenging customer for the proof of concept because our model has so many variables. CACI helped us develop an excellent algorithm based on our business rules.”

When reps take orders, they’re placed in holding batches for each territory.

This tool groups the orders and allocates them to trucks, factoring in different sizes and type of truck to suit delivery access, at the destination. The algorithm also embraces daily time limits for drivers and variable speed limits on the route, to ensure prompt and accurate delivery times.

Logistics coordinator Brittany Landry runs the CACI’s software twice daily. “We plan it to run two days before the target delivery date. Each territory rep has a quota to fulfil and they fill up the holding batches.”

“We’ve recently implemented cart retrievals,” adds IT manager Christian Joseph. “It’s a big addition to the project. We had our Lean process, harvesting crops onto carts and putting them into our staging area. We have to get the carts back and we were doing it by hand, which was incredibly time consuming. When realised that we could get the cart retrievals handled by CACI Logistics it freed up a lot of time.”

The Benefit

CACI Logistics has helped Prides Corner save a huge amount of time on manual processing, by automating both delivery routes and scheduling and cart retrievals. Instead of six logistics planners, the firm now only needs one.

Sales rep Brad Sorenson says, “Before, I was spending as much as 40% of the day planning deliveries, rubbing out and correcting to get everything fitted together. Now, I meet our logistics planner Cheryl Records at 9am: she shows everyone the plan and we spend half an hour reviewing it to tweak it – that’s it.”

Despite being based in another country and time zone, support from the CACI team has been strong, according to Christian Joseph: “CACI being in London wasn’t an issue – the support has been rock solid. Our account manager was fantastic in answering our questions before go-live. We threw a lot of curve balls and she knocked them out of the park. They have a great virtual working set-up.”

Ray DeFeo is pleased with the impact of  CACI’s route optimisation solutions on sales rep recruitment and training. “One of the biggest challenges a person would have, on top of potentially being new to the nursery business, they also had to understand the logistics pattern and how to route a truck. This is not a core sales skillset. Now, we can concentrate on recruiting and retaining people with great selling and customer service skills – logistics is separate.”

“Since 2012, our sales have doubled, but we haven’t had to increase the size of our sales teams. The Lean Flow approach and CACI’s software enable our reps to handle bigger territories because they can focus on sales. They’re happy because they have scope to make more commission with a bigger area to go at.”

Brad Sorenson adds, “Talking to drivers, they feel that their routes are now more efficient time-wise. They can start with the customer that can open earliest and keep moving without delays. The drivers really do like it.”

Prides corner estimates their mileage savings at ten per cent or more, which could mean annual savings of over $100,000 in transport costs.

Download the Case Study

You can read and download the Pdf version of the case study by clicking here. Find out more about our route planning software here, or get in touch with us here for more information.

Cleaner air, but at what cost?

Cleaner air, but at what cost?

We are more aware of our environment than ever before due to an increase in greenhouse gases, holes in the ozone layer, environmentalists protesting on our roads and pollution in our cities. Despite being the 15th best country for air quality and the 6th most environmentally friendly country, our government is under pressure to show that they are trying to improve and meet the ever-stringent environmental targets they are faced with. We all know that it’s the right thing to do, but it comes at a cost to individuals and businesses as we adjust to a new way of life. However, there are ways that we can minimise that cost by being more efficient and planning ahead.

Anyone who has lived in an inner-city area will be aware of the high levels of pollution from vehicles, contributing to lower air quality, especially along busy roads. This increases people’s risk of heart and lung disease and asthma. To help reduce this, local governments are starting to introduce clean air zones where certain vehicles are either not allowed to enter or will be charged a fee for doing so. The aim of this is to encourage drivers to use newer vehicles which meet the Euro VI emissions standard, to purchase ‘zero emission’ vehicles such as those powered by electricity or hydrogen, or to use public transport.

London introduced its first low emission zone in 2008 for large commercially operated diesel vehicles and expanded this in 2012 to cover vans, minibuses, utility vehicles and more. In April 2019 an Ultra-Low Emission Zone (ULEZ) was created, covering the same area as the congestion charge zone in inner London, but applying to a wider range of vehicles including cars and motorcycles.

Vehicles entering these zones have their number plates read by a network of cameras and must either meet the newer emissions standard or the drivers will be charged a daily fee of between £12.50 and £100, depending on the vehicle type.

Since the ULEZ has been launched the London Assembly claims that it has reduced the number of polluting cars driving in the zone each day by 44,000 and that toxic NO2 concentrations have been reduced by 44%.

From 25 October 2021, the ULEZ in London will be significantly expanded from central London to create a single, larger zone up to the North and South circular roads. This is an increase in area of 1,809% (21-380km2) and covers 3.8 million people, compared to the existing ULEZ zone is which covers 203 thousand people.

For drivers of diesel cars older than September 2015 and some pre-2005 petrol who want to enter this zone at any time of day, this means that they will have to pay a daily charge or have to spend thousands upgrading to a newer car. The average price to buy an electric car is around £44,000 – almost 1.5 times the average salary in the UK so this option isn’t feasible for everyone. From a personal point of view, I own a perfectly good 2011 VW Golf diesel, but as the CACI offices in West Kensington are now within the ULEZ zone, this means I’ll have to pay the charge or buy a new car if I want to come into the office.

Car drivers are not the only ones who will be impacted by the expanded ULEZ zone. Delivery drivers, logistics companies and people living in the zones will also be negatively impacted by the changes. Specifically, anyone delivering goods inside London will need to ensure that they are driving a newer vehicle which meets the emissions standards, or they will need to pay the charge. This inevitably will be passed on to customers who will be paying for living in an area with lower pollution.

London is not the only city that is affected by low emission zones. CACI have recently undertaken a study into low emission zones and have discovered that in addition to London there are five other UK cities with low emission or clean air zones currently in place, including Bath, Birmingham, Brighton, Oxford, and York. In addition, a further ten cities are proposing to launch low emission zones in the next couple of years. Some of these low emission zones in these cities only currently apply to buses, taxis, or HGVs, but it is likely that they will be extended to include all vehicles in due course, as has been seen in London.


Comparing the existing and expanded ULEZ zones in London

So, if you’re responsible for a fleet of commercial vehicles, keeping the costs down and also meeting customer expectations – what do you do about it?

Based on the research into low emission zones, CACI have created a dataset of both the current and proposed low emission zones across the country. Knowing the location and extent of these zones is useful in understanding the demographic profile of people living within the areas for marketing and planning, especially as there is likely to be a greater demand for electric vehicles, cycle lanes and environmentally friendly transport solutions in these areas. CACI’s behavioural demographic solutions Acorn and Ocean can help identify households that are likely to be concerned about their environment and those who might be most affected by changes to transport infrastructure.

For logistics companies scheduling deliveries, knowing whether an address falls inside a low emission zone will help calculate any additional delivery charges that need to be applied or determine if that delivery should be served by a more modern, lesser polluting vehicle. If you need to plan for vehicles entering these zones on a daily basis but need to minimise your costs, whilst achieving your carbon efficiency targets, the dataset can be used in conjunction with your route planning software (such as CACI’s Pin Routes), so that the application can identify the roads and customer addresses that fall within the zones, and can plan the routes to minimise the cost whilst still meeting customer requirements.

As the number of low emission zones increases and we are forced to change the way that we travel, we can look forward to a further reduction in air pollution in our cities. However, the significant cost to both individuals and businesses as we change the way that we go about our daily lives is something that cannot be ignored. These environmental challenges are not going away, legislation and environmental targets are likely to become more and more stringent, meaning that we need to put in a solution now.

How CACI supported Landsec track performance through 2020

How CACI supported Landsec track performance through 2020

The challenge

The opportunity for Landsec to re-engage customers and their spend as we emerge from the pandemic is substantial. 2020 saw the greatest level of consumer disruption ever seen in living memory with mandatory retail and leisure closures, stay at home orders, and schools and offices closing.

Landsec’s key questions included; who is driving performance, where they are coming from, how much are they spending per category, what they are doing in centre, and how are they engaging ? This helped the Landsec team identify why guests have reengaged and how to influence future behaviours. Tracking information was also used to provide the data points needed to allow Landsec to measure ROI on marketing and leasing activity.

The solution

CACI’s solution used transactional spend and mobile data to track real life actual behaviour in the centre. Mobile data looks at GPS tracking from mobile apps and helped Landsec understand the visitation patterns.

Transactional spend data is derived from credit and debit card spend data from multiple sources, including top UK retail bank and credit card companies. Again, this data was used alongside CACI’s data sources to and understand which categories and brands were driving spend and transactional changes.

Catchment spend for all the centres was also tracked using the transactional spend data, as well as a valuable indication of online spending for the centres’ shoppers.

The benefits

The data was used by the Landsec centre teams to fully understand the immediate impacts of the pandemic and how the centres performed over this period. In addition the research gave them an understanding of how best to react to the easing of future lockdowns in 2021. The research is now being rolled out across the whole of 2021, to track performance on a regular basis for some of Landsec’s key assets.

Read the case study

Read the full customer story here. To find out more about how CACI can help you support your business, please get in touch.

How Will Our Work and Home Life Co-exist as Measures Are Lifted?

How Will Our Work and Home Life Co-exist as Measures Are Lifted?

For many of us, COVID-19 has been the most significant, and perhaps the most traumatic, experience of our lives. It has had a huge impact on us as individuals, as a society and as a workforce. While some things will return to some semblance of pre-pandemic normality, many things have changed forever and have become our ‘new normal’.

Overnight, lockdown measures forced many of us to work from home which has led to the normalisation of remote working. This more flexible way of working has allowed more time with the kids, the opportunity to walk the dog in the park at lunchtime as well as being at home when online purchases are delivered.

Living and working locally means we are spending more time at home, spending more money on our local high streets, and supporting local businesses. In CACI’s Wealth of the Nation Report analysis that focuses on the changing movement of the population across a pandemic and the impacts of wealth touch on this point.

But How Will Our Working Behaviours Change as Measures are Lifted?

As part of our assessment of the Future of our Office Space, CACI has published a ranking of the HOT 100 Work From Home (WFH) locations. This analysis has identified the top locations with the highest volume of workers likely to change their working habits and work from home more frequently as a result of Covid.

This analysis prompts us to question whether the pandemic has affected the way our work and home life co-exist?

At the height of the pandemic last year there was a lot of discussion about whether we would return to the office and, if so when and how often? What would be the impact of working remotely and how would this affect how we communicate, connect, and create? And what will our workplaces look like if our offices are virtual and we lose those social interactions?

As Lockdown Measures Are Lifted and We Are Being Asked to Return to the Workplace, What Will Be the Outcome?

CACI’s weekly COVID analysis has shown that while there is a clear desire to get back to the office, businesses must adapt to the changing worker needs. Furthermore, we have established that 2.8 is the optimum number of days a week workers would ideally like to spend in the office in the future.

So, what will people do for the remainder of the traditional 5-day working week?

While certain businesses depend on face to face and in person experiences to exist, many more can operate in a virtual environment. They have become accustomed to using video conferencing platforms which have seen a huge surge in use that is unlikely to change in a post-COVID world.

People now want to be able to split time working between home and the office meaning office-based time will focus more around collaborating and networking with colleagues.

As remote work is adopted as the ‘new normal’, many are choosing to leave big cities in favour of more local and suburban areas which have seen an increase in flexible working environments reflect our changing behaviours and needs.

Since April 2020, CACI has been producing free weekly reports that have focused on the changing movement of your customers and our communities. Amongst many of the findings to come out of this analysis we have established that money has historically been used to buy freedom of movement, and throughout the pandemic – for those who have money – it has bought people freedom to stay still.

It is very clear from the data that affluent community groups have had the choice to stay at home and make use of local amenities, while those less affluent and more disadvantaged groups have needed to travel further for personal or work purposes.

Retail Marketing Group Deliver Better Campaign Results Using Data, Analytics and Field Force Optimisation Tools

Retail Marketing Group Deliver Better Campaign Results Using Data, Analytics and Field Force Optimisation Tools

Retail Marketing Group are a multi-award winning Field Sales and Marketing agency specialising in Consumer Electronics, with insights and data to help brands better understand their customers, retailers and the marketplace.

The Challenge

In the past Retail Marketing Group faced a number of challenges – call files were selected based on individual’s knowledge of the market and long nights were spent wrestling with Excel and rudimentary maps to create territories and call schedules.

Retail Marketing Group needed a more efficient and accurate way of defining call files, calculating headcount, designing efficient territories and optimal call schedules. The goal was to reduce the cost of planning and running their field teams.

The Solution

They use CACI’s Retail Footprint catchment model to tell them where people shop and a mix of Acorn demographic and marketing data to tell them where their targeted consumers live. This allows them to identify the best stores to visit and set the most beneficial contact strategy.

InSite FieldForce makes sure that the headcount for each project is correct, that territories are planned in an efficient way and identifies the ideal place to hire field agents pre-campaign. CallSmart produces optimal call schedules and allows Retail Marketing Group to accurately estimate mileage and required overnight stays so they can budget effectively and quote clients with accuracy.

Adding CACI’s InSite FieldForce, CallSmart, Retail Footprint catchment model and Acorn Demographic database to our portfolio of solutions
for field marketing has meant that we provide much stronger, more efficient, data led solutions to our clients. We gain a better understanding of the optimal solution for a campaign from the start, meaning fewer reasons to rework projects throughout.

David Rivers – Business Intelligence Manager

The Results

Retail Marketing Group licence a number of CACI’s solutions and utilise them to plan outsourced field teams for their clients and support pitches for new business.

Having the software in-house means Retail Marketing Group can continue to accurately quote clients, improve results due to visiting more appropriate stores for the specific campaign, reduce costs through optimal routing, hire people in the right places first time resulting in reduced recruitment costs, give the field agents a sense of fairness by utilising territories at the right level, and massive time savings for their team of analysts who use the software.

Further Information

If you want to hear more about how CACI’s field force expertise can help you and your team, get in contact now. We have a range of solutions that can help you optimise your field force.

Republic Technologies Maximise ROI From Their Field Sales Team

Republic Technologies Maximise ROI From Their Field Sales Team

Republic Technologies are a long standing customer of CACI, a partnership that allows them to use CACI’s team of expert consultants to help them plan the deployment of their field sales team.

The Challenge

Republic Technologies had a number of vacancies in their field sales team, but they did not know the best places to recruit. Nor did they know whether they needed to fill all these vacancies; could they scale the team back and still achieve their target call rate?

Their territories were imbalanced, with some people working far more hours than other, and the team was spending too much time driving. They wanted to optimise the territories to ensure that each person was working the same hours and maximise the time spent with customers.

Based on the anticipated changes to the territories Republic wanted to provide each sales person with a plan of attack to help them get around their customers in the most efficient way

The Solutions

CACI worked with Republic’s field management to address these challenges. Using CACI’s proprietary InSite software, we started with headcount analysis, and employed our travel time algorithm to understand the driving the field team would have to make between calls to understand exactly how utilised the current team was, and how utilised it would be if the headcount changed. Based on these calculations the correct team size was established, giving Republic the confidence that they had struck the right balance.

From this optimised structure CACI used it’s CallSmart route optimiser to deliver a set of efficient routes for each field sales rep.

We have worked with CACI for several years now; overall we have found their services invaluable and have managed to complete field sales team changes in very little time. On the most recent brief the changes were up and running in no time at all with the output requiring very few manual tweaks. Good Job.

Gavin Anderson MISM, General Sales Manager

The Results

CACI’s work has allowed Republic to quantify the hidden work in a sales persons day – driving, to truly understand the correct size of their field sales team. This ensured Republic were maximising the return on investment from this team.

The territory optimisation improved the balance of work across the team and reduced the amount of time spent driving. CACI confirming not only the number of vacancies but where these would be located to reduce fuel bills.

The routing gave each sales person the daily sequences of visits that reduced the time they spent in the car, and the time they spent planning.

Further Information

If you want to hear more about how CACI’s field force expertise can help you and your team, get in contact now. We have a range of solutions that can help you optimise your field force.