Last mile short cuts: Accurately predicting delivery stop times

Last mile short cuts: Accurately predicting delivery stop times

Planning and Understanding Dwell Time

90% of online customers prefer to have their goods delivered to their home location. Source: Statista “Online deliveries and returns in the United Kingdom (UK) 2022

How can the shortest distance in the logistics fulfilment process cost the most? We’re not even talking about the last mile – this is about the final metres of your delivery. Navigation and mapping will take your vehicle close to the final address, but between that point and finding the entrance and delivering the products on the doorstep, the margin of error can be large if you’re not using a data-driven approach.

Precise address data makes a significant difference in reducing logistics costs, specifically with premise addresses versus postcodes. In dense urban areas, a postcode can encompass many individual dwellings. In rural areas, it can cover large, sparsely populated areas along miles of road.

Arriving outside of the correct address for the first time and understanding its accessibility will cut delivery stop time by ensuring your driver covers the minimum possible distance from vehicle to entrance. If you factor in an average saving per drop of 30 seconds compared to a postcode-based approach with the number of deliveries each driver makes every day, it’s easy to see how companies involved in delivery fulfilment can make significant savings using this type of solution.

Organisations can further refine the accuracy of stop time by utilising additional data points (and not all of them are geographic). Enhanced property level address data provides insight on whether you’re delivering to a top floor flat or a detached home, whether the property is likely to have a driveway to park on or across, and the distance of the property from the road. These insights will ultimately enable you to factor in any additional time required to reach the front entrance and deliver the products. Using detailed data about the demographic and segmentation of households also enables you to understand the type of consumer you’re delivering to and model predictive behaviours of the customer at a specific address, helping you predict stop times more effectively and, for example, estimate the likelihood of a failed delivery because no one is in.

More accurate information enabling precise premise address level stop times can mean allowing more or less time for a delivery as opposed to using an average for all delivery stops. This may result in achieving fewer deliveries per shift or achieving more through having the data to enable improved delivery scheduling and route optimisation. Regardless, being realistic is vital to improving the accuracy of delivery time slots for customers and estimated time of arrival (ETA) calculations and ultimately, improved customer service. If you set average times to schedule delivery stops on a route, you risk hasty deliveries, speeding, poor parking or rushed and inaccurate customer communication as drivers struggle to meet their targets. This will reduce profits and affect your brand’s reputation as well as making it harder to recruit and retain delivery staff.

The most efficient overall solution for the last mile is to use all the data you have combined with rich property-level address data, demographic and segmentation data and local contextual data to help plan accurately and realistically.

You can then set clear customer expectations and proactively keep customers informed while also providing drivers with the most useful information. Unrealistic estimates will create knock-on delays that affect driver productivity and morale, and ultimately disrupt more scheduled deliveries.

Finely tuned stop times allow improved optimisation for further savings as well as enhanced customer service. In order to best approach this:

  • Quantify factors for calculating stop times by analysing property level data, accessibility, demographics and customer segmentation along with local contextual data.
  • Build a stop time model and cost to serve surface, identifying addresses with a longer stop time and higher cost to serve. This can be combined with delivery product information to further refine.
  • Use the model to input into route planning, scheduling and e-commerce tools so you can exploit routing efficiencies, inform delivery choices and strategies.

CACI has unique strengths in blending consumer understanding with accurate, up-to-date premise addressing and property insight data to address the precise priorities of your business and customers.

Our smart solutions and algorithms can condense a range of place and people variables, including property type, property age, number of floors, building height, parking permitted, road type, road restrictions, distance from road, distance from school, presence of driveway, weight of traffic, postcode or household level demographics and customer segmentation data.

Could you use some help with accessing detailed data that would allow you to calculate stop times accurately and put together your models so you can deploy an accurate approach and reap the benefits quickly? Get in touch with us to learn more about the shortest route to implementation at iwheeldon@caci.co.uk

Check out the other blogs in the Last mile short cuts series:

Detailed local population insight to inform service provision in a new Central London life sciences hub

Detailed local population insight to inform service provision in a new Central London life sciences hub

Highlights

  • Granular demographic data for a dense urban population
  • Accurate insight reflecting rapid urban change, updated annually
  • Data to blend and visualise with other specialist datasets
  • Local population profiling to provide relevant services
  • Supporting local accessibility and inclusion

About Impact on Urban Health, Guy’s & St Thomas’ Foundation

Guy’s & St Thomas’ Foundation was previously known as the Guy’s & St Thomas’ Charity. It is an independent foundation whose mission is to invest, partner, engage and influence to come at big health challenges from all angles. The Foundation and its family of organisations collaborate with communities, partners and hospitals, using its assets to transform lives.

Impact on Urban Health is part of the Foundation, with a specific remit to make urban inner London and similar areas healthier places to live.

The Challenge: Understanding the impact of the Snowsfields life sciences hub

Guy’s & St Thomas’ Foundation has created a 300,000 square foot life sciences hub with world-class lab facilities. The development is adjacent to the Guy’s Hospital campus in Southwark and will form part of a new health innovation cluster in central London.

To assess the impacts and benefits of the development for the local community, the property team asked Impact on Urban Health to help them understand more about the needs, lifestyles and characteristics of the people who live nearby.

The Solution: Acorn demographic data for a densely populated catchment

Data Analyst Alessandra Denotti is responsible for generating insight for Impact on Urban Health projects. She used CACI’s Acorn demographic data to map profiles of the population in the immediate area around the proposed Snowsfields development.

The Benefits: Detailed, accessible and actionable population data visualisations

Project Director Emma Davies studied Alessandra’s insight presentation to understand the local population better, in order to design and propose relevant services within the Snowsfields development plan for local residents to use.

Emma explains:

The data insight work was done to review the make-up of the local community in the area surrounding the Foundation’s Snowsfields development site. Acorn enabled us to determine who we have living in and around our place at Snowsfields using the Acorn classification tool which shows demographic and lifestyle demographics at a postcode level. It was a really interesting exercise. This enabled us to better determine what services we should look to provide in the development scheme, to be more inclusive to the local community, at a very early stage in our proposals.

Find out more

Please view the full customer story here. If you want to learn more or have any questions please get in touch with us.

Last mile short cuts: the value of knowing your cost to serve

Last mile short cuts: the value of knowing your cost to serve

Have you been hearing a lot about cost to serve lately? At the recent Last Mile – Leaders in Logistics event, it came up in practically every conversation we had with attendees and logistics experts.

If cost to serve is top of your agenda, we’d like to share some insights into how we calculate it and what you can do with the information. If it’s a relatively new concept to you, we plan to demystify and explain it in the following paragraphs.

Cost to serve is a valuable metric because it enables logistics operators to drive efficiency and support decision-making by understanding fulfilment costs across the entire supply chain.

Logistics operators and retailers are interested in the cost to serve for a range of different reasons. Depending on your organisation’s strategic priorities and current pressures, you might apply the insights to any of the following:

  • Retail network strategy, incorporating fulfilment costs
  • Multi-tier returns strategy and pricing
  • Reduce fuel costs and optimise your existing fleet
  • Transition and selection of electric vehicle (EV) fleets – ‘what-if?’ scenarios
  • Site selection, weighted by cost to serve
  • Sales forecast modelling, balanced by cost to serve
  • Scenario modelling, driven by cost to serve

There’s a relatively simple sum to calculate cost to serve: distance + fuel + time + environmental impact + resource. Measuring each element individually first, we look at the distance from distribution centre (DC) to store as well as from the store or distribution point to the end customer address. Fuel is costed according to delivery vehicle type. The time a delivery takes will take into account variable traffic and route conditions as well as accessibility on the doorstep. Emissions, noise and congestion add up to the environmental impact. And lastly, there’s the resource cost – including people, vehicles and equipment.

The sum might look fairly straightforward but gathering the data and putting it into comparable formats can be challenging. You may be familiar with data for distances, fuel consumption and resource costs, but tracking and estimating time to deliver can be more difficult, particularly in the last few metres when your driver is outside the vehicle.

Environmental impact is another measure that might be new to your business, but it’s increasingly important from a financial perspective as well as being a customer concern and area of corporate social responsibility. Emissions charging, tolls and vehicle tax all add cost into logistics and it’s important that they’re visible when it comes to planning and optimising services.

Cost to serve is a holistic measure that shows the true overall cost of a delivery or type of delivery. It puts each element in context, because they all influence each other.

You can understand and tackle the most expensive cost to serve areas and apply best practice and understanding from areas with a lower cost to serve. It can help you prioritise future investment and reveal opportunities to streamline processes or boost training.

The logistics market can change fast – the recent fossil fuel price hikes were unexpected. Consumer preferences and competitor activity can affect your operation quickly. That’s why it’s not just a strategic measure: it’s important to monitor cost to serve continuously, so you can react quickly to emerging trends and keep control of costs throughout the supply chain.

CACI’s blend of logistics expertise and customer understanding can give you the edge when it comes to adding value and differentiating your services profitably. We can line up the data so you can measure your cost to serve accurately and keep your logistics operations delivering effectively, with a clear, business-wide understanding of costs and all the factors that affect the supply chain. Get in touch today at iwheeldon@caci.co.uk

Check out the other blogs in the Last mile short cuts series:

Last mile short cuts: the latest data-driven approaches to your biggest logistics challenges

Last mile short cuts: the latest data-driven approaches to your biggest logistics challenges

Logistics data + customer understanding = optimal efficiency and competitiveness for logistics operators

That’s the first short cut we’d like to share with you in our series of concise last mile insights blogs. Inspired by our recent visit to the Last Mile – Leaders in Logistics event, we want to give you the lowdown on the latest proven techniques that can help you sharpen your efficiencies and improve your margins… and maybe transform your approach to some of the tough challenges that everyone in the sector is facing at the moment.

We had some great conversations at the Last Mile event, which helped us focus even harder on the key issues for sustained success and growth in logistics. Customer understanding and routing intelligence are key to effective planning for the last mile in a fast-changing, high-demand delivery market. Everyone wanted to talk about making the most of resources to match efficiency and cost management needs. Balancing this with customer expectations and the need for speed is a complex challenge.

Up to 55% of the total cost of logistics operations are incurred in the Last Mile.

Source: ATOS

Logistics organisations need to manage costs by adopting the most efficient service propositions. To identify these, they need to calculate demand accurately, for return logistics as well as deliveries. They need precision route planning solutions to help optimise routes and schedules, taking a data-driven approach to help them deploy the right fleet in the best way for different schedules.

39% of online customers are most frustrated by the time to get products delivered.

Source: SOTI “From Bricks to Clicks” report 2021

Dealing well with change and variation is key in a high-volume consumer market. Predictive modelling helps organisations anticipate changes that will affect delivery schedules and customer requirements. Customers are constantly raising the bar on expectations of their home deliveries – they want the full range of pick-up options, availability of slots, fast same day or next day delivery and greener options.

Data is your not-so-secret weapon. Keep customers up to date with clear, proactive communication based on forward visibility from realistically planned schedules. Data modelling that reveals the ease or difficulty of accessing every property can inform realistic stop times and improve efficiency. Customer insight based on behavioural and demographic data helps you to create variable delivery cost models and fulfilment options to meet different situations and customer preferences.

90% of online customers prefer to have their goods delivered to their home location.

Source: Statista, Online deliveries and returns in the United Kingdom (UK) 2022

To succeed and grow market share, logistics operators and the brands that use them need to deliver excellent customer experiences. With good historic and predictive data, you can be ready to meet ever more challenging delivery expectations and communicate positively with end customers. This can open the way to offering more green and sustainable services in a way that benefits customers, the environment and your bottom line.

The really big question is – how can your organisation do any of this in practice, in an affordable and low-risk way? In our coming blogs, we’ll zoom in on specific issues in a straightforward way. We’ll explain how we can help your logistics organisation optimise its approach to each challenge by using intelligence, data and tools in a smart and focused way.

With CACI’s logistics consultancy, you can make the unknown known, and own the future of your business. Get in touch today at iwheeldon@caci.co.uk

Look out for the next blogs in the Last mile short cuts series:

All you needed to know about the UK Census | CACI

All you needed to know about the UK Census | CACI

What is the census and what is its purpose?

First launched on 10 March 1801, the UK census is a decennial questionnaire undertaken by the Office for National Statistics (ONS), National Records of Scotland (NRS) and Northern Ireland Statistics and Research Agency (NISRA) that asks a variety of demographic questions on age, sex, marital status, health, education, and housing. 

 The primary purpose of the UK census is to build a detailed snapshot of society at that current point in time. Helping national, regional, and local governments understand the people and households in their constituencies. This allows these government agencies to develop current policies or create new ones, as well as plan and fund services, including education, medical facilities such as doctor’s surgeries and hospitals, and transport infrastructures such as roads and new train routes. 

 The census is also used for other purposes, helping organisations and companies understand the society they interact with. This includes: 

  • Voluntary organisations using census data as evidence to support any applications they make for funding.
  • Academics and Education Institutions use census statistics to support research that they are working on.
  • Businesses using census information to help them understand their customers more effectively, i.e., a retail chain might use census population data to help decide where to open a new store.

How often is the UK Census, and when is the data released?

The census is run every ten years and typically collects information from the public in the first quarter of the calendar year of the decade.  ONS for England and Wales, and NISRA for Northern Ireland had a Census Day on 21 March 2021. However, on 17 Jul 2020, NRS recommended to Scottish ministers that the 2021 Scottish Census be moved to 20 March 2022 due to the COVID-19 pandemic.  

The responsibility for running the UK censuses is split between ONS, NRS and NIRSA based on their geographic region. The Office for National Statistics hass overall responsibility for publishing census records and statistics for the whole of the UK. 

The data from the census is typically released in phases. For instance, in the first phase for England & Wales, local authority level population and household estimates were released, in June 2022. The three census offices each have their own timetable, with outputs staggered across a period of one to two years.  

Because Scotland’s census took place a year after the rest of the UK, reference dates will differ. This will impact the comparability of UK census data, for this version. 

Due to this, the three census offices are working closely to develop UK-wide census records, which involves consideration of how best to meet the challenges around comparability, coherence, timeliness, and accessibility of the information. 

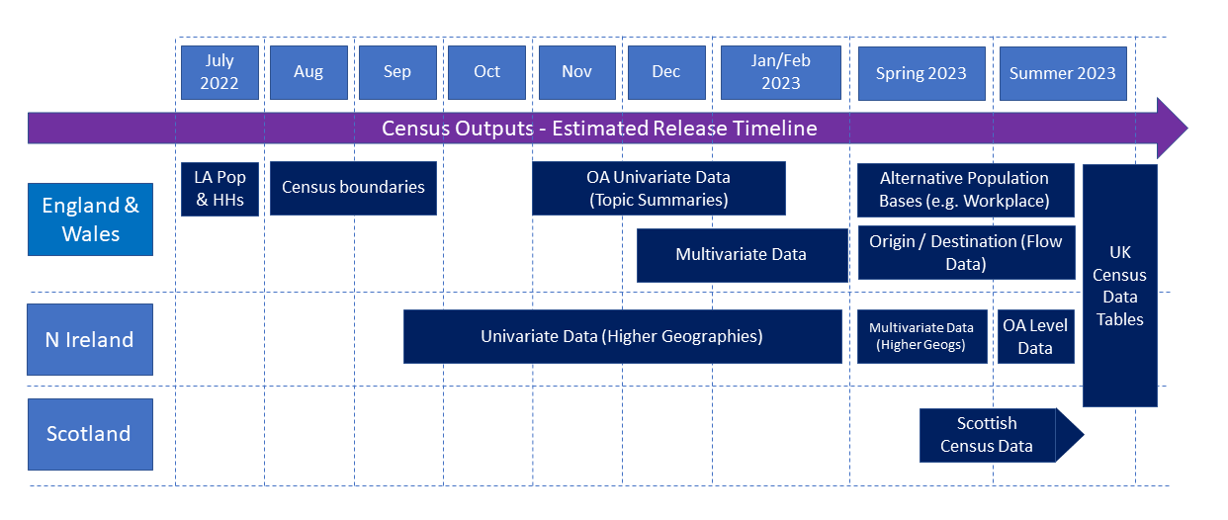
Below is an approximate timeline of the different subject releases based on the various census offices. 

KEY
LA POP – Local Authority Population Data
HH – Household Estimates
OA – Output Area

CACI and the UK Census

CACI has been processing, analysing, and modelling Census data since 1976, when we became the first Census Agency in the country. 

The data from the UK census is used as input for many of CACI’s products, including Acorn, Address Spine, Ocean and Fresco. A wealth of companies uses these products, public sector bodies, charities, and not-for-profit organisations to help them understand their current customers, constituents, or beneficiaries more effectively, as well as market their products and services to like-minded individuals that fit the same demographic profile of their existing customers, saving them both expenditure and resource.

We also use the census as the baseline for CACI’s annual Up-to-Date Demographics release, which provides the latest estimates of key census variables (e.g. age, housing tenure, presence of children). These are modelled forward using various, more frequently updated data sources. As the census is carried out only once every ten years, this provides an increasingly more reliable view of the population than the census data itself. UptoDate Demographics is available at census output area level. Consistent with this and for even more complex use cases, our annual Population and Household Estimates and Projections provide counts down to individual postcode levels and project forward for future years. 

The first results of Census 2021 were published on Tuesday, 28 June 2022. These provided estimates of the number of people and households in England and Wales at local authority level. From this data, CACI was able to provide insight into the data to help:

The Ageing Population – The ageing population shown by this census follows our own predictions very closely, so it comes as no surprise. It does however throw up two significant questions. Firstly, what does this mean for pensions? With proportionately fewer working people to retired people, will there be a greater emphasis on private pensions to cover the state shortfall? And secondly, what does this mean for senior living facilities? We’ve recently been pushing the message that senior living needs to be looked at more rigorously in terms of its role within the wider housing stock and that all types need to be taken seriously. The 2021 census only serves to vindicate that, and we would encourage local authorities and senior living developers or providers to engage with the data now to understand what their existing and future residents need, to ensure we have a fit-for-purpose housing mix for an ageing population.  

Regional Growth and ‘Levelling Up’ – It is great to see regions other than London taking the top spots in terms of population growth. It finds itself behind the East of England and South West, and in joint third place with the East Midlands, in terms of percentage increase. More noticeable for their omission from the top of the charts are those regions further from London. Wales, the North East, and Yorkshire and The Humber are lagging behind quite significantly in terms of population growth, suggesting that the pull of living within reasonable commuting distance of London is still strong. Salaries of course have a big role to play – the closer you are to London the higher both salary and disposable income tend to be. The growth we’re seeing in the census is more or less restricted to the southern part of England, so there is clearly a lot of work to be done with the ‘levelling up’ agenda, to entice people further away from the capital. 

New release

On Wednesday, 2 November 2022, ONS also released their Demography and Migration Data for England and Wales, their second release of Census 2021 data as part of their topic summaries.

This includes an update to population and household estimates for England and Wales, which now includes unrounded data by sex and single year of age, providing even more detail on individuals who were previously in age bands. This meant that on Census Day, the size of the usual resident population in England and Wales was 59,597,542, which was the largest population ever recorded through a census in England and Wales. This meant that the population grew by more than 3.5 million (6.3%) since the last census in 2011 when it was 56,075,912.

It also contains information on household and resident characteristics, including household size, composition, deprivation status, and people’s marital and civil partnership status. Providing detailed insight into the makeup of the 24.8 million households across England and Wales. Such as although the number of households has increased to 24.8 million (up 6.1% from 23.4 million in 2011), the average household size in England and Wales in 2021 was 2.4 people per household, which is the same as in 2011.

Migration data is also included in this release providing further information on country of birth, passports held and year of arrival, helping us to understand internal and international population changes. For instance, of the 3.5 million (6.3%) increase in population from 2011 to 2021, 57.5% is positive net migration (the difference between those who immigrated into and emigrated out of England and Wales).

Additional Information & Resources

ONS (England and Wales) – https://www.ons.gov.uk/census

NRS (Scotland) – https://www.scotlandscensus.gov.uk/2021

NISRA (Northern Ireland) – https://www.nisra.gov.uk/statistics/census/2021-census

UK Government Census Whitepaper –https://assets.publishing.service.gov.uk/government/uploads/system/uploads/attachment_data/file/765089/Census2021WhitePaper.pdf


Northumberland County Council used Paycheck data to inform its Local Plan

Northumberland County Council used Paycheck data to inform its Local Plan

Highlights

  • Up-to-date, annually refreshed income data
  • Comparing communities, not just towns
  • Revealing inequalities in detail
  • Supporting post-Covid recovery and growth
  • Objective basis for strategy and resource allocation

About Northumberland County Council

Northumberland County Council looks after a population of over 320,000, in England’s most northerly county. Northumberland is one of England’s five largest counties, with widely distributed towns and communities of varying types and populations.

The Challenge: Understanding the needs of different neighbourhoods

Senior Economic Analyst Julie Dowson provides data to departments across the council, from housing and planning to public health and regeneration. She says:

“Our communities have such wide differences – it’s really important to look at them at a granular level and compare them. That’s where the Paycheck data comes in. We need current, household level information to understand exactly where people are experiencing challenges, so the council can target plans and funds to address them”.

The Solution: Household-level Paycheck data reveals areas of need and opportunity

Northumberland County Council also uses Paycheck insight to feed into its annual Economic Performance Assessment and five-year economic strategy. Julie says, “You can’t plan based on subjective assumptions – the Paycheck data provides objective evidence to support our policies, priorities and programmes. That means everyone in the Council as well as our partners and customers can see and understand why we’re focusing our resources in particular areas.”

The Benefits: Targeted help and support for towns and communities

Northumberland County Council used Paycheck data to inform its Local Plan. The outputs influence Strategic Housing Market Assessments and Land Assessments, which identify potential locations for additional housing and indicate what land may be released for future housing development. This helps Northumberland County Council to plan enough affordable homes to meet residents’ needs in different housing developments across the county.

Continue reading the full case study

To view the full customer story click here.

To find out more about how we can help your organisation do amazing things with data, please get in touch.

Understanding the impact of the cost of living in the water sector

Understanding the impact of the cost of living in the water sector

The current impact of the cost of living crisis is being felt across the country. Being able to understand how these impacts are being felt across different customers groups and forecast future changes is imperative to creating a proactive customer support strategy. At CACI we have been researching and collating consumer insights and data on the cost of living to help you support your customers.

Some of the key insights we’ve seen from the research so far include:

  • Lower and middle affluent family groups are feeling the pressure the most
  • More than 2/3 of consumers have already started to change their behaviour by reducing their discretionary spend
  • Younger generations are more likely to turn to overdrafts and Buy Now Pay Later schemes to protect their social outgoings
  • Rising cost of energy bills has impacted all demographic groups, prompting high levels of concern ahead of the winter months
  • Economic uncertainty means 75% of consumers are worried about their own, their families, or other people’s finances

What does this mean for the water sector?

The water sector sits in a unique position with defined customer service areas that have a wide range of demographics, and a historically unengaged customer base resulting in a low awareness of support available for vulnerable customers.

CACI recently ran a roundtable to share key insights and discuss how the impact of the cost of living is being felt in the sector, and how water companies are looking to prepare for future forecasted impacts. The key outcomes from the session were:

Innovative partnerships provide new avenues – partnering with councils and landlords to identify and understand the set up for affordable housing allows support to be better directed to those that need it most.

Contact centres provide the first indication of change – whilst payment rates and direct debits currently remain strong after the summer months, the first sign of concern being seen is the increase in contact centre calls for help and support.

Clarity between water efficiency messaging and cost of living is needed – being able to identify the difference between a change in water use for environmental reasons vs to cap bills is key to ensuring the right messaging reaches the right customers.

Engaging the unengaged – is still a priority, in particular identifying those that qualify for social tariffs or support that aren’t currently using them.

Making insights actionable

Having the right data and customer understanding in place is key to enabling proactive communications, and to ensure the right support can be provided to customers. CACI’s data science team has created tools such as web-based water poverty tools, bespoke vulnerability indicators and forecasting tools to help you build proactive strategy with data driven insight.

As we continue to monitor the changing situation, sign up to our Cost of Living Podcast to get monthly updates.

Find out the full spectrum of work CACI does in the water sector from our Water Brochure.

For more detail on how CACI can support through enabling actionable insights, contact us here.

Neighbourhood cost of living insight from Paycheck and Household Acorn data

Neighbourhood cost of living insight from Paycheck and Household Acorn data

Highlights

  • Current data that shows year on year change
  • Granular, household information
  • Enables benchmarking and ranking
  • Trusted evidence for funding bids and investment
  • Accessible, visual information for a wide audience

About Dumfries and Galloway Council

Dumfries and Galloway Council is responsible for the delivery of all local authority services to nearly 149,000 people living in both urban and rural areas in the southwest of Scotland.

The challenge: Understanding the needs of different neighbourhoods

Gregor Docherty is Dumfries and Galloway Council’s Economic Development Officer. He explains: “Although we have some data of our own, we don’t have the range and breadth of it to provide the information the council needs today. I was given the challenge of improving our data insight, to give us a clearer view of the areas the Council looks after and the needs of the people who live there.

The solution: CACI’s data provide valuable insights

Dumfries and Galloway Council has access to Paycheck income data for two years. Recently, Gregor decided to add the Household and Wellbeing Acorn datasets to the subscription.

The addition of Household and Wellbeing insight provides a granular picture of lifestyle, income and risk factors at a local level, so we can really examine areas of need and deliver value and impact from the council’s services and programmes.

The benefits: Clear, trusted and detailed insight into household income change

Dumfries and Galloway Council successfully applied for Borderland Inclusive Growth Deal funding, using information modelled from CACI’s data. Gregor created a Dumfries and Galloway datazone profile, bringing together all the available information to rank the towns in the Council’s area for funding priority. The analysis revealed the four priority towns for funding, which was approved.

Continue reading the full case study

To view the full customer story click here.

To find out more about how we can help your organisation do amazing things with data, please get in touch.

Supporting your Grocery Retail Strategies with Data Driven Intelligence

Supporting your Grocery Retail Strategies with Data Driven Intelligence

As with every industry Grocery Retail has had to adapt to a seismic shift in consumer attitudes and behaviour.

And those attitudes and behaviours continue to shift in response to local, national and even global events. The consumer has weathered the pandemic but is now staring down the challenges borne out of a cost of living crisis.

So, you need to make important decisions, and quickly. Flexibility is key. Having the data and tools at your disposal to make anything from adjustments that impact fine margins, right up to transformational change, is essential.

An innate understanding of your customer – their attitudes and behaviour – gives you the insight you need to attract new customers and retain existing ones. It’s also the foundation to building strong brand loyalty, even in challenging times.

CACI know more about your customers than anyone else. We combine a market leading demographic classification system with highly detailed footfall and spend data to provide you with everything you need to know about the way customers interact with your brand, your locations, and your competition.

For confident decision making, for greater market share, for sustainable and accelerated business growth – make your strategic location intelligence partner CACI

Strategic decisions need strategic insight

CACI offer unrivalled insight into the fundamental relationship between people and place. Understanding this relationship speeds up decision-making and minimises risk from Cap Ex investment.

We are supporting grocery retailers with insight on:

  • How customers engage with your brand in a physical and digital environment
  • The demographic profile of the catchment of each of your stores
  • The spend potential of the catchment in any location
  • The shifts in footfall and spend across times of day
  • The profiles of customers engaging with your competitors
  • Other locations similar to your best performing sites
  • Data driven network expansion driving the most ROI
  • Creating the right formats for the right locations to serve the local communities

At the end of this work, we had a growth plan to refer to, which meant we could prioritise and focus incoming opportunities. With tangible, data-led evidence and a well-defined process and criteria, we could make decisions more quickly

MidCounties Co-operative

Unprecedented insight into the grocery retail market

Understanding the way customers interact with your brand, and how potential customers engage with your competition, is the first step to increasing your market share.

And with a complete view of the competitive landscape both nationally and locally, you will have the tools you need to develop strategies for success.

At a customer level you can:

  • Discover the demographics that are drawn to your brand
  • Discover those that aren’t and why
  • Find out when they spend, how much they spend and what they spend their money on
  • Drive customer loyalty and win larger share of wallet
  • Identify highest spending customer groups and locate more of them

At a location level you can:

  • Find out where your current and potential locations rank in terms of spend
  • Benchmark locations against a national average across a range of criteria
  • Model catchment areas and market share catchments
  • Forecast how a particular location will change over time factoring demographic shift
  • Understand your local market share and competitor spend
  • Identify key growth opportunities in your store estate
  • Inform partnership strategy to generate greater footfall
  • Measure impact of your and competitor activity, e.g. marketing, store refurbs, etc

The CACI Consumer Spend Data has been instrumental in Sainsbury’s breaking new ground in our understanding of the evolution of multi-channel grocery. With it we can now observe changes in consumer spending and preference across channels at both national and local level and can see market dynamics play out in near real-time

Sainsbury’s

The analysis to understand the digital / physical dynamic

The relationship between physical and digital has evolved, and demographics more inclined to visit a store are now comfortable online.

How has this affected your store network?

And how does online halo impact your performance across your physical store network?

Different demographics behave differently and will even favour different brands for different channels.

CACI can make sense of this and measure the success of each of your locations well beyond just what goes through the tills. Your best performing site might not be so obvious!

Optimising your store network with this analysis in your hands allows you to make the right decisions without negatively impacting on your multi-channel revenue lines. Future proof the business by effectively forecasting online as well as in store grocery demand.

Get in touch with us to show you how we do amazing things with data.

Click here to view our recent Guide.

Using data and analysis to support Lancaster University Future Places Centre

Using data and analysis to support Lancaster University Future Places Centre

The Future Places Centre (FPC) builds on Lancaster University’s pioneering projects on pervasive computing, the Internet of Things (the IoT) and the natural environment, on ‘futures thinking’ and data science. Funded by the EPSRC (Engineering and Physical Sciences Research Council) the FPC works to create a portfolio of applied research endeavours that help the University and the communities it serves better understand the places in which they exist.

The Challenge

Professor Richard Harper is Co-Director of the Institute for Social Futures at Lancaster University. He explains: “We need research data to help energise the change agenda in the North West for space and place. We want data both for measurement and to help us reimagine the environment and community and see things differently. It’s a broad remit.”

Senior Research Associate and Data scientist Jan Hollinshead had used CACI data in previous commercial roles. She approached CACI to talk about how the data might be applied in the context of academic research. “We’re looking at how to segment the human population, so profiling data for the community seemed really relevant. We decided to take the CACI data for a year, to see whether it delivered value for our projects.”

The Solution

Richard says, “We’ve used the data as a resource that brings together sociodemographic information to categorise the communities around Morecambe Bay. Because our project is about making changes over a five-year period, it provides an essential baseline measure.”

The team also used it to challenge assumptions about the characteristics and economy of towns and sociodemographic groups around the Bay. This can help them focus more effectively and objectively on the most pressing issues and opportunities to investigate.

Acorn helps the Future Places Centre team to understand the demographics of residents and communities in focus project areas, so they can attract a diverse range of people to those areas.

The Benefits

Richard explains:

CACI’s data is an objective third party resource that gives clear socio-demographic profiling linked to maps – it’s an invaluable tool for us and our partners in the Future Places Centre. It’s a trusted baseline that helps us see where we need to create more specialised research for particular project requirements. Overall, it’s helping us identify issues and opportunities that will make our region healthier and more sustainable over the coming five years.

Professor Richard Harper, Co-Director of the Institute for Social Futures at Lancaster University

Find out more

To find out more on how CACI’s solutions help the Lancaster University Future Places Centre to improve outreach and regional initiatives, read the full case study here. To find out more about how we can help you support your organisation, please get in touch.