Case study
Using the H3 geospatial tiling system to improve spatial resolution of demographic data
Summary
A method has been established by CACI that uses a hexagonal tiling system to disaggregate demographic and other population-based data down to small scale to enable more accurate and precise location modelling and forecasting, particularly in countries where such data is only available at a high geographic level.
Industry
Technology
Products used
H3 Geospatial Tiling System
Challenge
CACI have data for over 250 markets covering 95% of the world’s countries. However, the detail of data available varies from country to country. One of the limitations for certain use cases is the size of geographic area at which demographic data is available, as this data drives understanding of locations and consumer demand at a local level. In countries such as Kazakhstan, Saudi Arabia, and parts of Middle East Asia, the granularity of data is such that there may be only one geographic area with one set of figures for a whole town or municipality, so understanding demographic and spend dynamics in different parts of that town is not possible.
The challenge was to find a way to disaggregate high level geographic data to smaller areas.
CACI provides data for 95% of the world’s countries
In some countries available demographic and spend data is high level, and a methodology was sought to disaggregate such data to make it more usable for understanding local markets
This methodology would be applicable across all countries providing comparable levels of detail worldwide
Solution
CACI resolved this challenge by combining the source data with two geographic datasets.
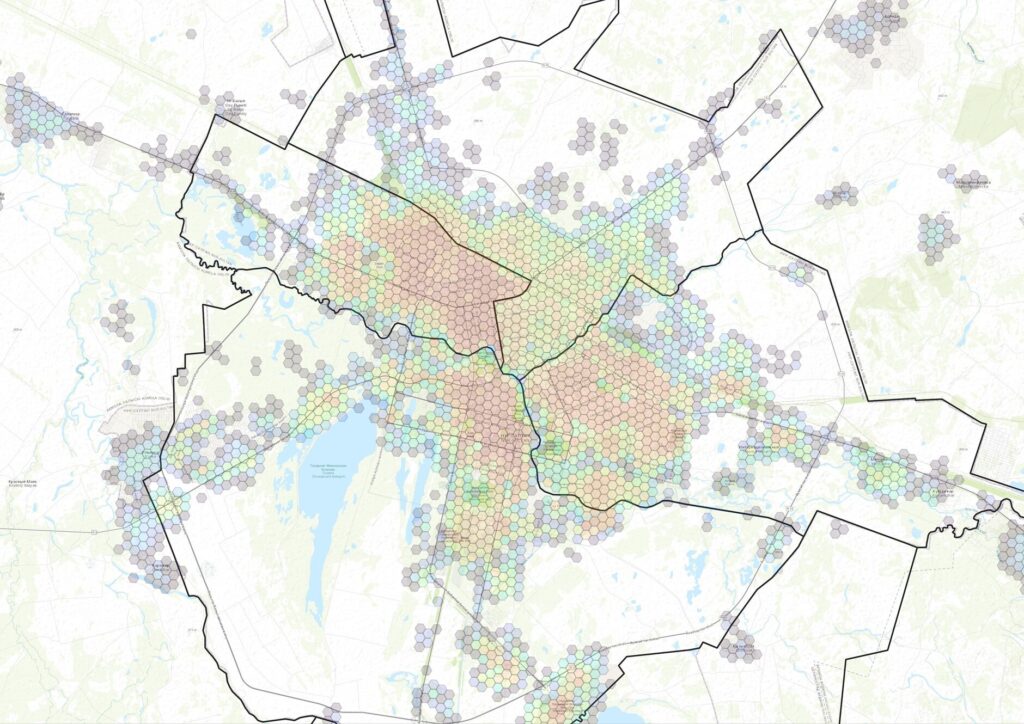
The first is H3, which is a discrete global grid system for indexing geographies into a hexagonal grid, developed at Uber. These hexagons are available at a range of scales, but the one considered most suitable for the majority of CACI’s client market applications is “Level 9”, which provides hexagons approximately 400m wide.
These hexagons could be overlaid onto the supplied data boundaries to disaggregate the data equally across all hexagons within each boundary. This would assume that the population was evenly distributed in each area, which is a very simplistic approach. Better to weight this by the population across the area, and to do this a second dataset was used; population estimates based on official sources as well as other sources such as satellite imagery of buildings, giving very granular results.
By combining this with the H3 hexagons we could assign demographic and spend data to each hexagon using the distribution of total population as a weighting function, so that those hexagons containing higher population would receive a proportionally larger share of the source data.
Scale is a challenge due to the computational requirements for these calculations, but with an optimised work flow, and using powerful data platforms this process has been highly successful.
Results
H3 has revolutionised how we are able to advise clients on consumer demand. We have taken what was previously high-level market data and disaggregated it to deliver more localised, insightful analysis. For example, in Saudi Arabia, we previously had a view of just 8 broad, high-level regions, which are now disaggregated into over 30,000 hexagonal zones, unlocking a level of detail never before possible in the region.
By using H3, we apply a consistent geographic lens across the world. This allows CACI to seamlessly blend multiple data sets, such as mobile data, with demographic data to create a single, unified view. This creates a reliable single source of truth that enables a more granular and accurate view of markets that can be compared across countries for more informed decision making.
This granular view is a game-changer for any organisation wanting to get a low-level view of market opportunity anywhere in the world.